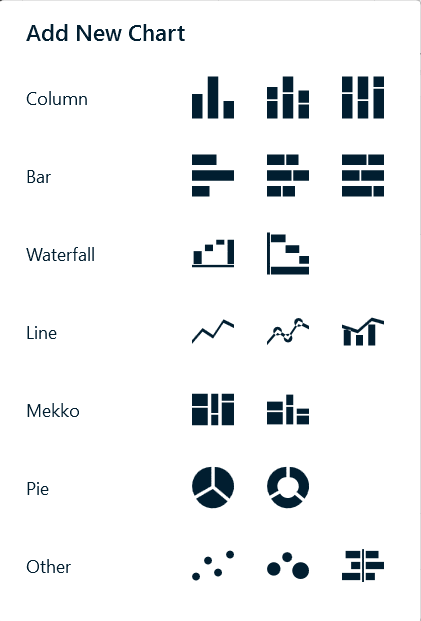
presentaid Charts give you the chart types and the annotation tools that consultants and analysts build by hand today - waterfalls, Mekkos, waffles, butterflies, growth arrows, CAGR lines, value lines and axis breaks - without leaving PowerPoint and without giving up the native chart engine.
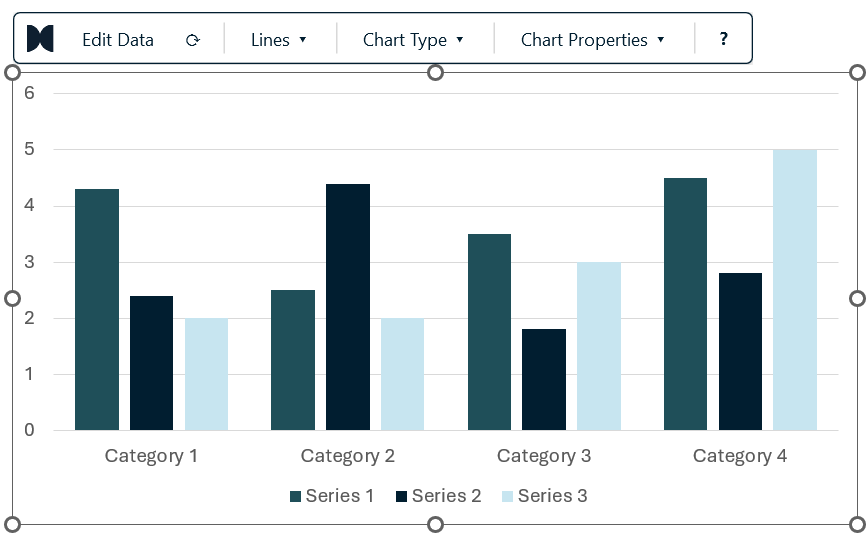
Your charts stay native PowerPoint charts
This is the most important thing to understand about the feature: presentaid never replaces the PowerPoint chart with a picture or a group of shapes. Everything you insert is a genuine PowerPoint chart with a genuine embedded data sheet.
That has consequences you will feel every day:
- Colleagues without presentaid can still open your deck, click the chart, and edit the data. Nothing is locked.
- The chart keeps following your corporate template, theme colours and fonts.
- Copy, paste, duplicate slides, and Slide Library round-trips all behave exactly as before.
- Everything presentaid adds on top - arrows, labels, connectors, break marks - is drawn as ordinary shapes inside the chart, so they travel with it.
The two halves of the feature
Chart types. A visual picker with the families you actually present: clustered, stacked and 100% stacked columns and bars, line and column+line combinations, waterfall (column and bar), Mekko in two variants, pie and doughnut, waffle, scatter, bubble and butterfly.
Chart decoration. A floating action bar that appears the moment you select a chart, giving you growth arrows, CAGR arrows, difference arrows, value lines, axis breaks, total labels, segment sorting, scale alignment across charts, and a live link to an Excel file.
Where to find it
Everything starts from the Charts group in the presentaid ribbon, or from Insert Chart in the Productivity Pane.