
Status Reports
Automate your weekly and monthly status reports. One click generates the entire deck.
Automated status report with RAG indicators
Key Benefits
Data-Driven Status Slides
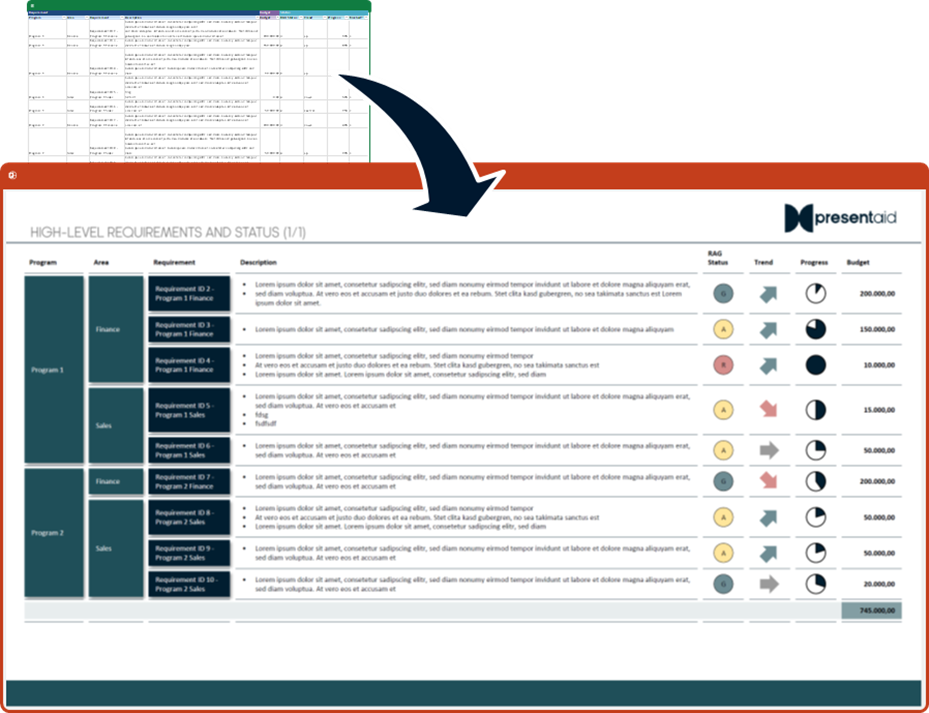
Connect your Excel tracker to presentaid's Dynamic Grid. Define your slide template once - then generate perfectly formatted status slides for every project.
Dynamic Grid generating status slides
Intelligent RAG Indicators
Set threshold rules and let presentaid automatically color-code your KPIs. Budget overrun? Red. On track? Green. At risk? Amber.

One Outlier Should Not Flatten the Rest
Status charts often carry one value that dwarfs everything else, and a standard axis flattens the rest into nothing. presentaid gives you the chart tools to handle this cleanly: axis breaks collapse the empty stretch so small values stay readable alongside outliers, with the axis showing the real numbers throughout. You can also lock two charts side by side to a shared scale in one click, so your audience reads a consistent story across the whole slide.
presentaid chart features for status reports
Charts That Survive the Weekly Rebuild
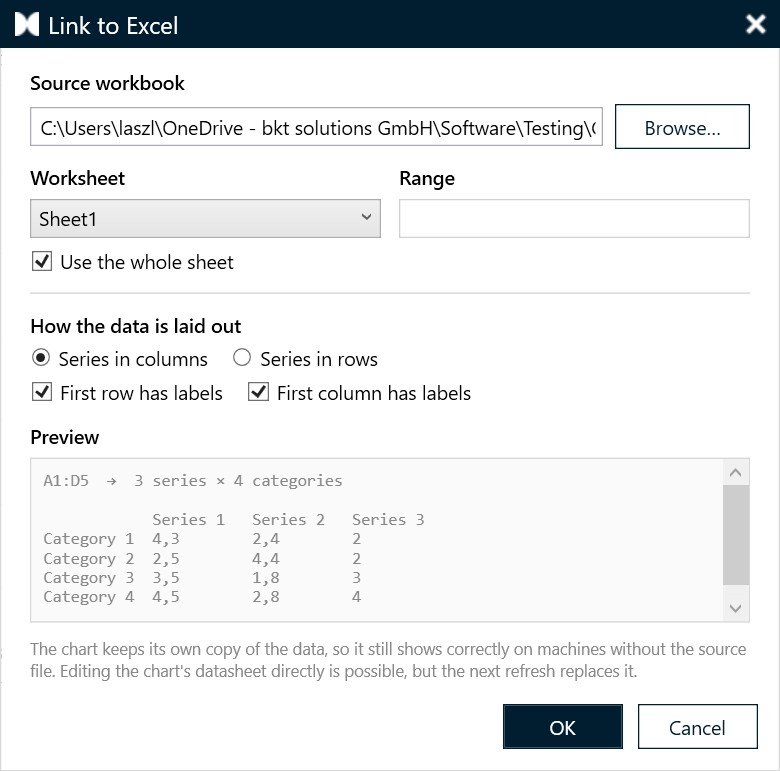
A status report is the same deck with new numbers, week after week - and the charts are usually where the time goes. presentaid keeps them native and refreshable: link a chart to your Excel tracker and pull the new figures in when you are ready, or type into the chart's own sheet. Every annotation - a growth arrow, a CAGR line, a target line across the plot - is anchored to the bars it describes, so it moves with the data instead of pointing at last week's numbers.
Executive-Ready Output
With Corporate Design compliance built in, every status report matches your organization's branding perfectly.
Trusted by Professionals Worldwide
See why leading companies choose presentaid for their presentations.
"With presentaid we have found a great helper, which really simplifies and speeds up our daily work with PowerPoint. And this, although we already use 2 other add-ins. But in fact, we haven't come across a tool before that groups, centers and aligns objects as quickly and easily as presentaid."
Dr. Michael Streng
Founder and Partner, parameta GmbH
"presentaid offers convincing simplifications in dealing with PowerPoint and Excel. Editing slides and shapes is clearly faster. I don't want to miss it anymore 😉. Thanks also for the excellent support with questions - fast and competent."
Petra Dürr
Head of PMO, Robert Bürkle GmbH
"presentaid cut our report creation time by 70%. What used to take hours now takes minutes — and looks better than ever."
Sarah K.
Senior Project Manager, Deloitte
"The auto-alignment feature alone justified the investment. Our slide decks are now pixel-perfect every single time."
Marcus W.
Management Consultant, McKinsey & Company
"Rolling out presentaid across 100+ users was seamless. Corporate design compliance went from 40% to nearly 100%."
Julia M.
Marketing & Communications, Deutsche Bank
Ready to Get Started?
Try presentaid free for 30 days.