
PowerPoint Charts
Create waterfall, Mekko, waffle, butterfly and scatter charts in PowerPoint - plus CAGR arrows and axis breaks - on native charts anyone can still edit.
The chart picker, opening at your mouse pointer
Key Benefits
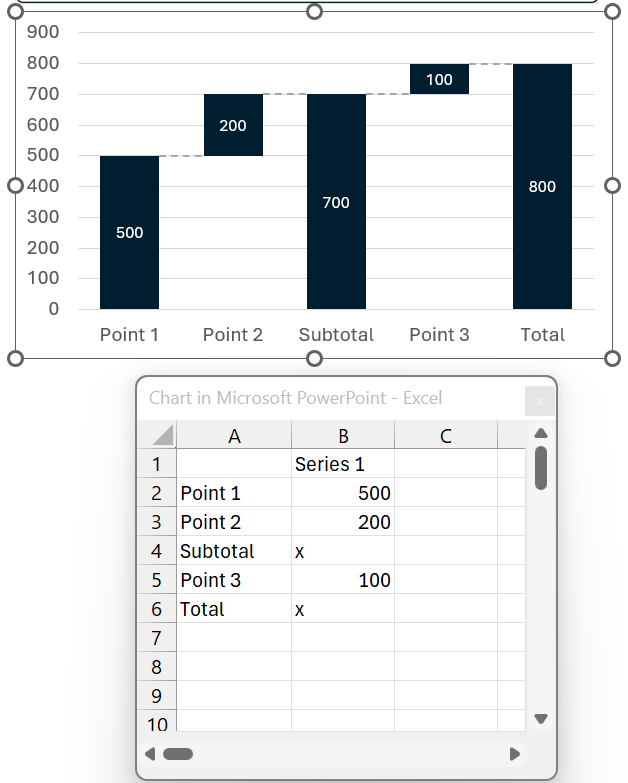
Waterfall, Mekko and Butterfly Charts in PowerPoint
Waterfalls, Mekkos and butterfly charts do not exist in PowerPoint. Today they get assembled from stacked bars and invisible spacers - and fall apart the moment a number changes. presentaid builds them properly: pick the chart type, enter your values, and the construction maintains itself. Layouts, connectors and labels update automatically whenever your data changes.
Waffle Charts: Shares You Can Count
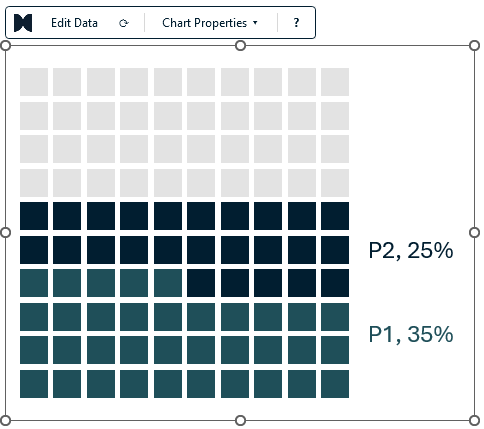
A waffle chart turns a share into cells you can count - 35% is 35 of 100 squares, and the rest stays grey. PowerPoint has no waffle chart, so it usually ends up as a hand-coloured table that has to be recounted every time a number moves. presentaid draws it from the data sheet: type names and values, and the cells redistribute themselves. Choose the grid size, cell size and spacing, squares, circles or other symbols, the fill order and a legend on any side - and the categories take your company chart colours automatically.
CAGR, Growth and Difference Arrows That Survive a Data Update
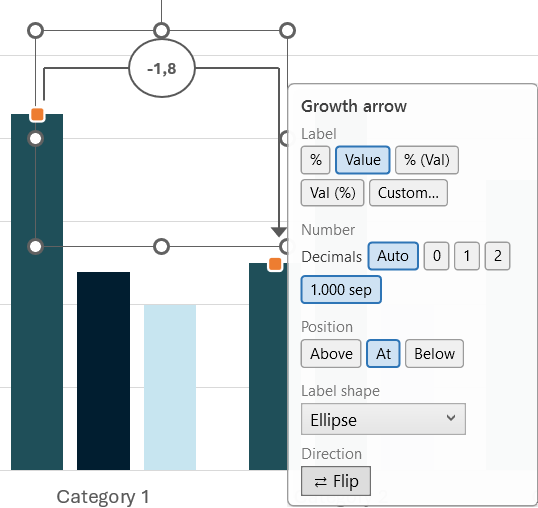
A CAGR arrow, a growth arrow, a difference arrow or a value line is what turns a chart into an argument. presentaid anchors each one to the bars it describes, not to a position on the slide. Change the numbers and the arrow moves with them, recalculates its label, and stays correct. The plot area even shrinks by itself so an arrow above the tallest column never overlaps the data.
Axis Breaks, Data Labels and Chart Formatting in One Toolbar
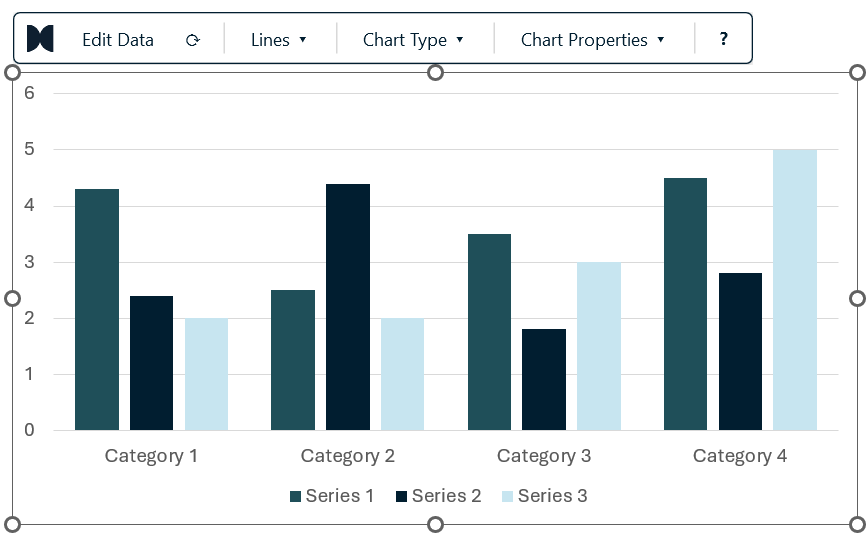
Select a chart and a small bar appears above it: edit the data, add annotations, switch the chart type, and open Chart Properties - font size, bar width, legend, data labels, axis scale and number format, all in one panel instead of five PowerPoint dialogs. Labels drawn on a bar pick black or white automatically, so a value never disappears into a dark column or a pale one.
Your Chart Design, Applied for You
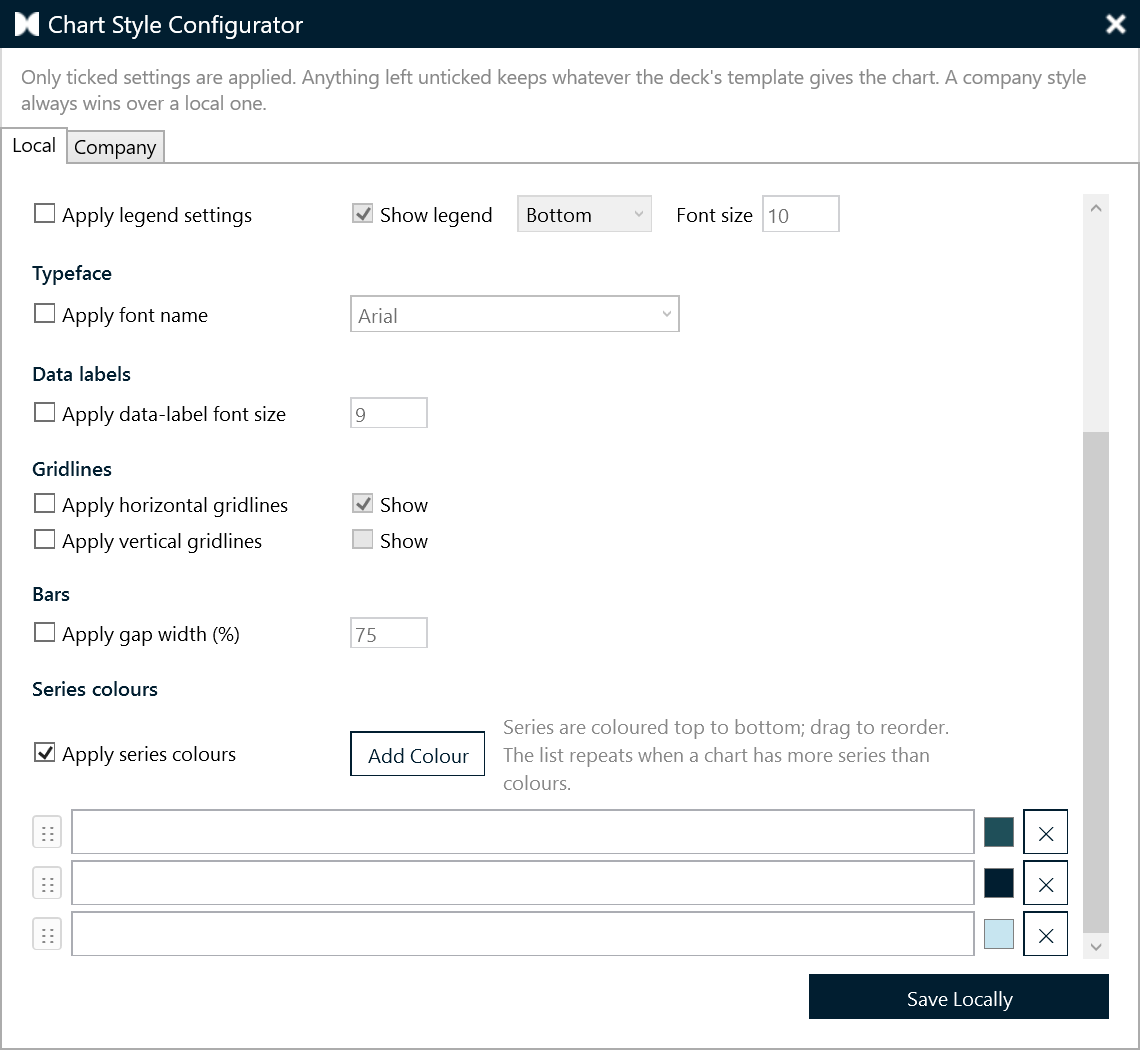
The Chart Style Configurator defines how every new chart should look - title, axes, legend, typeface, gridlines and an ordered colour palette. Publish it company-wide and nobody has to re-apply the house look by hand. Each setting is opt-in: what you do not tick stays exactly as your template left it. Add a series later and it is coloured from the palette automatically, without touching the ones already on the slide.
Linked to Excel, Refreshed on Your Terms
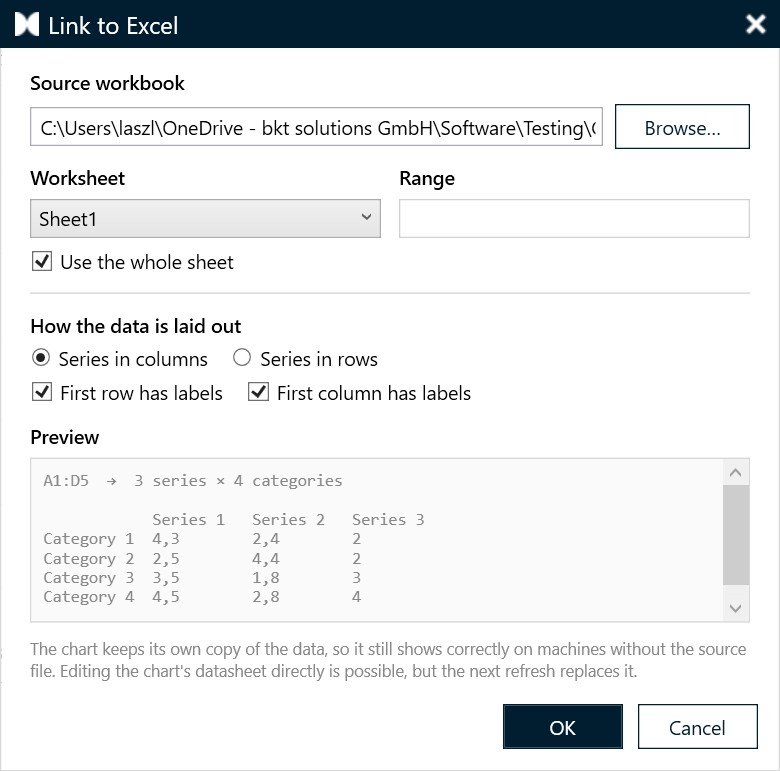
Point a chart at a range in an Excel workbook and presentaid writes those values into the chart's own data sheet. The deck stays self-contained - send it to someone without the workbook and the chart still shows its last refreshed data. presentaid never refreshes behind your back: when the source file changes, an amber alert appears on the action bar and you decide whether to pull the new numbers in.
Frequently Asked Questions
Trusted by Professionals Worldwide
See why leading companies choose presentaid for their presentations.
"With presentaid we have found a great helper, which really simplifies and speeds up our daily work with PowerPoint. And this, although we already use 2 other add-ins. But in fact, we haven't come across a tool before that groups, centers and aligns objects as quickly and easily as presentaid."
Dr. Michael Streng
Founder and Partner, parameta GmbH
"presentaid offers convincing simplifications in dealing with PowerPoint and Excel. Editing slides and shapes is clearly faster. I don't want to miss it anymore 😉. Thanks also for the excellent support with questions - fast and competent."
Petra Dürr
Head of PMO, Robert Bürkle GmbH
"presentaid cut our report creation time by 70%. What used to take hours now takes minutes — and looks better than ever."
Sarah K.
Senior Project Manager, Deloitte
"The auto-alignment feature alone justified the investment. Our slide decks are now pixel-perfect every single time."
Marcus W.
Management Consultant, McKinsey & Company
"Rolling out presentaid across 100+ users was seamless. Corporate design compliance went from 40% to nearly 100%."
Julia M.
Marketing & Communications, Deutsche Bank
Explore More Features
Ready to Get Started?
Try presentaid free for 30 days.