
PMO & Project Management
Generate project status reports, dashboards, and portfolio overviews from your data - in one click.
Dynamic Grid generating a portfolio dashboard
Key Benefits
Automated Portfolio Dashboards
presentaid's Dynamic Grid lets you define a slide layout once and automatically fill it with project data from Excel. Track budgets, timelines, RAG statuses, and milestones - all refreshed with a single click.
Dynamic Grid populating project data
Gantt Chart
Build polished Gantt charts directly in PowerPoint with presentaid's WYSIWYG Gantt editor. Define tasks, durations, and milestones visually - no formulas, no workarounds. Timeline visuals update automatically when your data changes, keeping your project roadmap always presentation-ready.
Gantt Chart editor in action
Standardized Reporting Across Teams
With presentaid's Corporate Design features, every project manager delivers reports in the exact same format. Custom style packages ensure consistent fonts, colors, and layouts across all PMO deliverables.
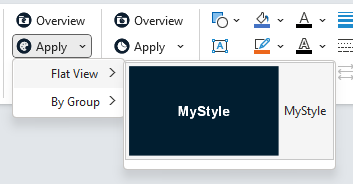
Libraries for Recurring Elements
Save your best-performing slide layouts, risk matrices, and status indicators to the presentaid Library. Any team member can access them instantly.
Shared library of PMO templates
Budget and Headcount Bridges That Update Themselves
Every steering committee asks the same question: where did the money go between plan and actual? A waterfall chart answers it clearly - showing each contributing factor as its own bar so the story is visible at a glance. presentaid lets you insert these charts directly in PowerPoint without workarounds. When the forecast changes, you update the values and the chart rebuilds itself - connectors, labels and running totals all recalculate automatically.
Budget and headcount bridge chart
Slide Radar: Keep Reused Slides in Sync
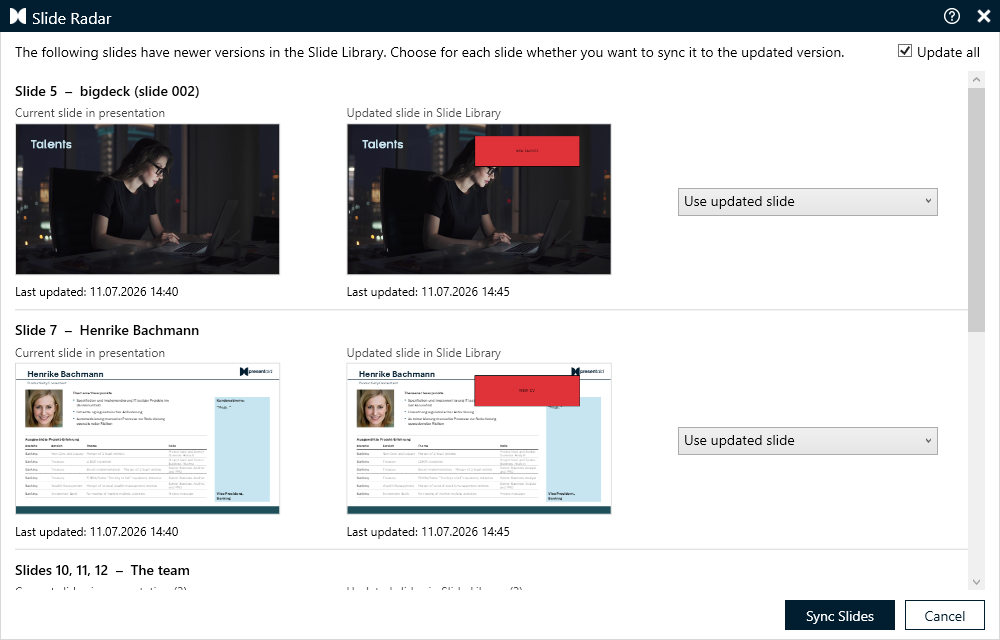
PMOs live on reusable slides - a risk matrix, a methodology page, a standard disclaimer - pulled from a shared library into report after report. Slide Radar keeps track of where every one of those slides came from, and lets you know the moment the original in the library gets updated. Instead of quietly presenting last quarter's risk matrix, you get a clear heads-up and a one-click way to sync to the current version.
Keep Report Decks Lean
Reports assembled from many contributors grow with every cycle: each copied slide can bring its own master, backup slides stay hidden in the deck, and chart workbooks carry far more data than the chart shows. The File Size Inspector finds unused masters and layouts, heavy hidden slides and oversized pictures, and tells you how much removing each one saves - so the steering committee deck stays small enough to share and quick to open.
File Size Inspector finding unused masters
Trusted by Professionals Worldwide
See why leading companies choose presentaid for their presentations.
5.0 / 5 · 3 reviews
PowerPoint add-in for teams that produce many branded decks
"presentaid brings layout, brand control, charts and reporting into the PowerPoint Ribbon. Its files stay native PowerPoint, so colleagues without the add-in can still edit them. The recent additions are useful: Design Checker for brand consistency, Charts with waterfall and Mekko, Dynamic Grid V2 with SharePoint and pivot table sources, and a File Size Inspector."
Klare Effizienzsteigerung in PowerPoint / Office 365
"presentaid liefert Consulting-Grade-Charts, die sich direkt in PowerPoint und Excel einbetten lassen. Für unser monatliches SteerCo funktioniert die Aktualisierung der Charts jetzt auf Knopfdruck. Früher war das jeden Monat Handarbeit. Auch bei neuen Slide Decks spare ich Zeit. Die lange Suche nach einer Vorlage entfällt, weil ich die freigegebene Unternehmensvorlage immer direkt zur Hand habe. Farben und Folienbibliothek sind im Tool verfügbar, ich starte also jedes Mal von einer guten Basis und baue ohne Mehraufwand Corporate-Design-konforme Folien. Insgesamt spart presentaid mir pro Woche mehrere Stunden bei Slide Design und Polishing."
Review in German
Julia M.
Head of RnD, Electrical/electronic manufacturing (501–1000 employees)
Verified review on Capterra · Oct 31, 2026A good tool for efficiency-focused presentation creation.
"Intuitive layout and carefully considered features for use in strategy consulting. The UI is easy to navigate and offers no features lacking compared to other add-ins, while still providing practical additional features. One gets the feeling that the features and roadmap are very closely aligned with the daily work of highly efficiency-oriented teams."Translated by Capterra
"With presentaid we have found a great helper, which really simplifies and speeds up our daily work with PowerPoint. And this, although we already use 2 other add-ins. But in fact, we haven't come across a tool before that groups, centers and aligns objects as quickly and easily as presentaid."
Dr. Michael Streng
Founder, parameta GmbH
"presentaid offers convincing simplifications in dealing with PowerPoint and Excel. Editing slides and shapes is clearly faster. I don't want to miss it anymore 😉. Thanks also for the excellent support with questions - fast and competent."
Petra Dürr
Head of PMO, Robert Bürkle GmbH
"presentaid cut our report creation time by 70%. What used to take hours now takes minutes — and looks better than ever."
Sarah K.
Senior Project Manager, Deloitte
"The auto-alignment feature alone justified the investment. Our slide decks are now pixel-perfect every single time."
Marcus W.
Management Consultant, McKinsey & Company
The CAPTERRA logo is a service mark of Capterra, Inc. and/or its affiliates and is used herein with permission. All rights reserved. Capterra reviews constitute the subjective opinions of individual end users based on their own experiences and do not represent the views of Capterra or its affiliates. The reviews constitute the subjective opinions of individual end users based on their own experiences and do not represent the views of Capterra, Inc., Nubera EBusiness S.L., Software Advice, Inc., or its affiliates.
Ready to Get Started?
Try presentaid free for 30 days.