
Decks rarely start from scratch. If yours contains charts built with another PowerPoint add-in, presentaid can convert them into native PowerPoint charts that it manages from then on - with a real data sheet, the action bar, and presentaid's own annotations.
Nobody in the room needs the other add-in installed to open, edit or present the result.
Recognising a convertible chart
Select the chart. If presentaid can convert it, the action bar appears with a single button - Edit with presentaid. That one button is the whole tell: an ordinary presentaid chart shows the full bar instead.
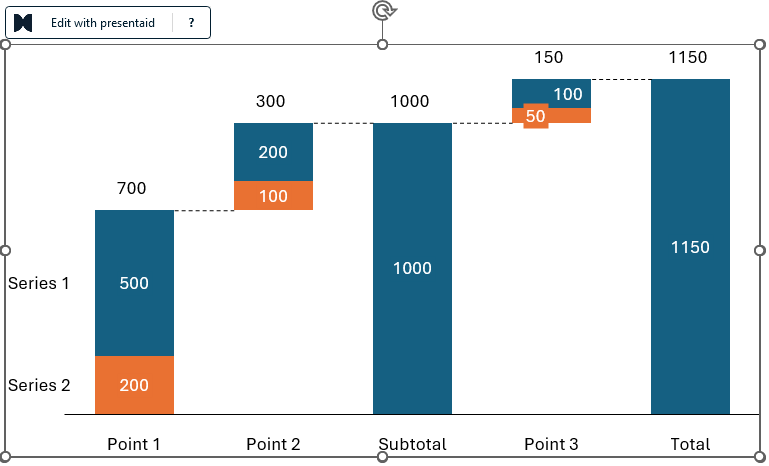
Converting one chart
Press Edit with presentaid. presentaid describes what is about to happen and asks you to confirm.
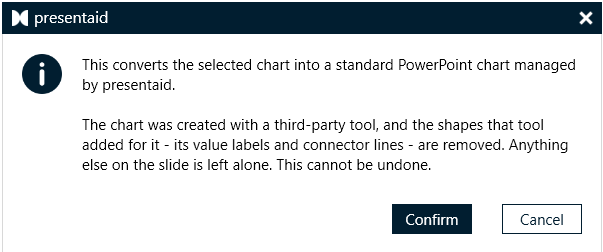
Confirm, and a moment later the slide holds one native chart in the same place, at the same size.
What comes across
| What the original had | What you get |
|---|---|
| Bars, columns, lines, stacked series | The same chart type, plotted from a real data sheet |
| Per-column colours | Kept exactly - a conversion preserves the slide, it does not restyle it |
| Value labels | Native data labels, in the same position and number format |
| Category names | Written into column A of the data sheet, so you can edit them |
| The legend | Kept, in the same place |
| Growth arrows, CAGR arrows, difference arrows, value lines | Real presentaid decorations - anchored to categories, recalculated from the data |
| Waterfalls | A presentaid waterfall, with its x total columns recovered |
| Marimekko charts | A presentaid Mekko |
| Axis breaks | Recovered and re-applied, so the collapsed scale still reads the same |
Because the annotations become real decorations rather than pictures, they recompute their own labels from the data from now on. Change a number and the growth arrow above it follows.
What to check afterwards
- The data sheet. Open Edit Data: categories down column A, one column of values per series. This is the fastest way to confirm the conversion read the chart the way you would have.
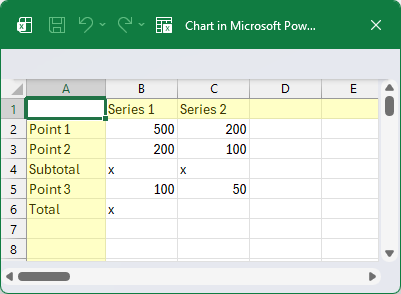
- Total columns in a waterfall. If a column did not add up to the sum of the columns before it, presentaid says so after the conversion and imports it as an ordinary value. It then shows as a floating segment instead of a full bar - fix it by typing x into that row.
- Annotations presentaid does not have. A Mekko carries labels that presentaid draws differently; anything that could not be mapped is reported rather than silently dropped.
Converting a whole deck
For a deck full of charts, convert them in one pass: presentaid ribbon → About → Expert Tools → Charts → Convert all Charts.
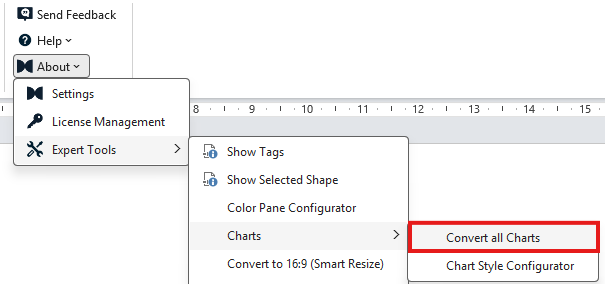
presentaid counts the charts first and tells you how many it found, because that number is the basis on which you are approving an irreversible change to a deck you may not have read end to end. Confirm, and it works through them with a progress window naming the chart and the slide it is on.
At the end you get one summary: how many were converted, how many could not be read, and each kind of imperfection worth a second look. A chart that cannot be converted is left exactly as it was.
After the conversion
The chart is a presentaid chart like any other. The action bar is complete, Chart Properties works, you can add decorations, link it to an Excel file, apply your company chart style, and the data sheet is yours to edit.