
Introduction
With the presentaid Gantt Chart you build project timelines right on your PowerPoint slide. There is no hidden Excel sheet and no extra tool: you click, drag and type directly on the chart, and what you see is exactly what ends up on the slide.
Every bar, milestone and label is a normal PowerPoint shape. Your chart looks sharp in any presentation, and colleagues without presentaid can still open and view it.
This guide walks you through everything - from adding your first chart to moving a whole project plan in time.
Add a Gantt Chart
Add a new Gantt Chart by clicking the button in the Ribbon or the button in the Productivity Pane.

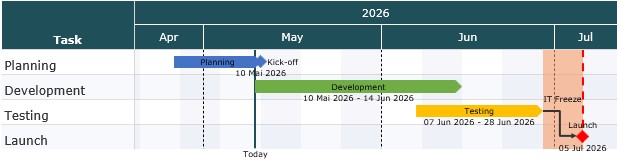
A new Gantt Chart with a few example tasks is added to your slide. Simply replace the examples with your own project.
Edit Your Chart
To edit a Gantt Chart, simply click it on the slide. The editor opens directly on top of the chart, and every change you make appears on the slide straight away.
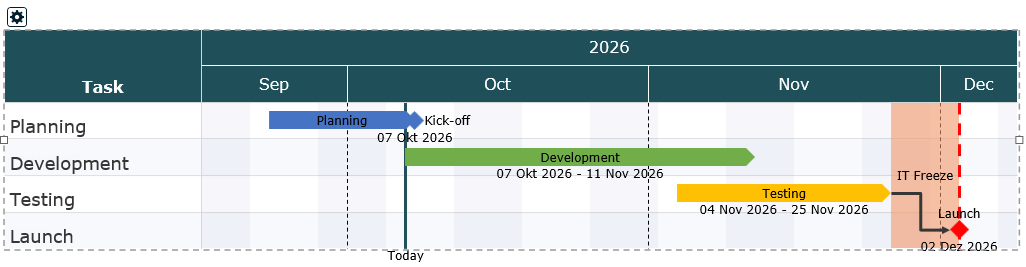
When you are done, click anywhere else on the slide. The editor closes and your chart stays exactly as you left it.
Almost everything in the editor works the way you know it from PowerPoint:
- Right-click anything - a task, a bar, the timeline - to see what you can do with it.
- Double-click a name or label to change its text, or an element to open its properties.
- Drag things to move them.
Work with Tasks
Tasks are the rows of your chart. Their names are shown in the task column on the left.
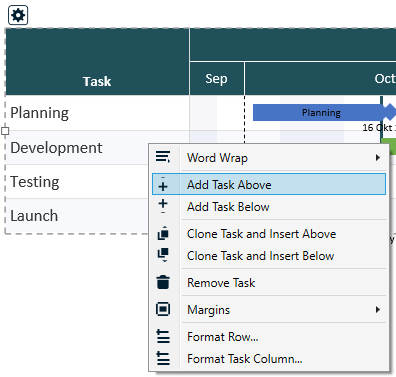
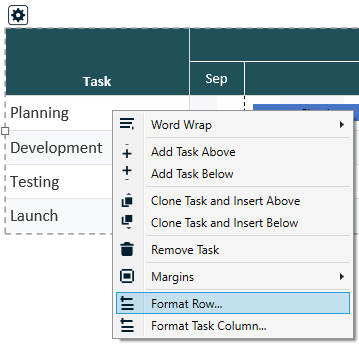
- Add a task: Right-click a task name and choose Add Task Above or Add Task Below.
- Rename a task: Double-click the task name, type the new name and press Enter. Press Esc to cancel.
- Change the order: Drag a task name up or down to its new position.
- Duplicate a task: Right-click the task and choose Clone Task and Insert Above or Below. The copy includes all bars and milestones of the task - handy for phases that repeat.
- Delete a task: Right-click the task and choose Remove Task.
- Format a single row: Right-click the task and choose Format Row... (see below).
Format a single row
Some rows deserve their own look - a taller row for a summary task, a highlighted phase, a different font. Right-click the task and choose Format Row...:
- Row Height: a fixed height for this row. 0 means automatic - the chart's row height, grown to fit wrapped text.
- Element Position: the distance from the top of the row to the centre of its bars and milestones. 0 centres them in the row.
- Own background: a fill colour for this row only, instead of the chart's striping.
- Separator Below: show or hide the separator line below this row, or follow the chart setting.
- Font and Font Size: for this row's task name and cells. A font size of 0 uses the chart's task font size.
Add Bars and Milestones
The bars, milestones and lines on your chart are called elements. Each element belongs to a task row.
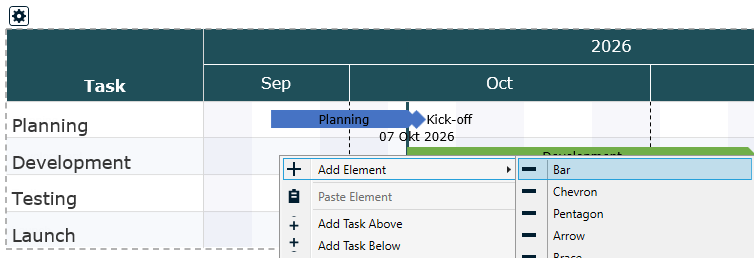
- Right-click inside a task row, at roughly the date where the element should start.
- Choose Add Element and pick the type you want.
- The new element appears at the date you clicked. Now drag it into its exact position.
Which element should I use?
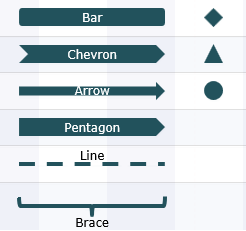
| Element | Good for |
|---|---|
| Bar | The classic task bar from a start date to an end date. |
| Chevron, Pentagon, Arrow | Bars with a pointed end - great for phases that lead into each other. |
| Brace | A curly bracket over a period of time, to visually group several activities. |
| Horizontal Line | A slim line over a period, e.g. for a buffer or a waiting time. |
| Milestone (Diamond, Triangle, Circle) | A single key date, such as a go-live or a review. |
| Milestone Global (Diamond, Triangle, Circle) | Like a milestone, but with a dashed line running through the whole chart - so everyone sees how this date affects all tasks. |
| Vertical Line | A line across the entire chart at one date, e.g. for "today" or a hard deadline. |
Move and resize elements
- Change the dates: Drag an element left or right. The duration stays the same.
- Change the start or end only: Drag the left or right edge of a bar.
- Move to another task: Drag the element up or down into another row.
Labels and dates
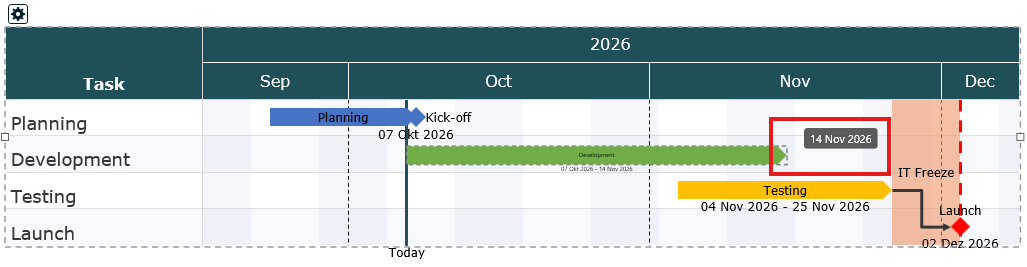
Each element can show a label (for example "Design" or "Go-Live") and its dates.
- Edit a label: Double-click the label text and type. Press Enter to confirm.
- Reposition a label: Drag the label. It snaps to the nearest sensible spot - inside the bar, above, below, left or right of it.
- Show or hide the date: Double-click the element and choose under Show Date whether and where its dates appear.
The way dates are written (for example 30 Oct 2026 or 30.10.26) is set once for the whole chart in the Gantt Settings, under General > Element Date Format.
Element properties
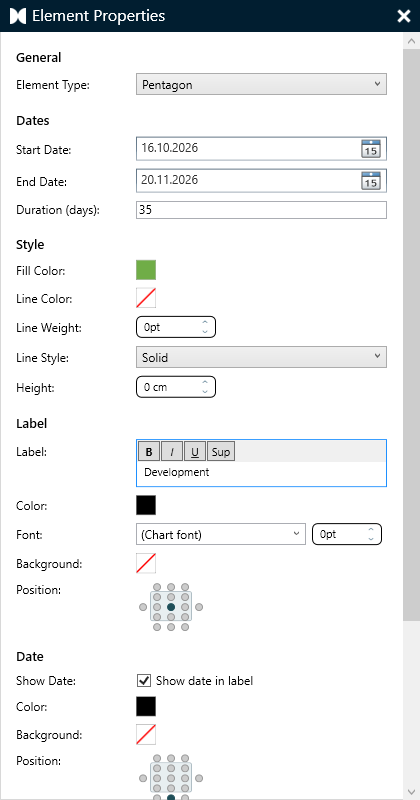
For full control, double-click an element (or right-click it and choose Properties...). The properties window lets you:
- type in exact start and end dates or a duration in days,
- choose the time of day for milestones (start of day, midday or end of day),
- set the fill color, the outline and the text margins,
- change the label and decide where the label and date are placed,
- give the label and the date their own color, font size and background - for example a white box behind a label that sits on a gridline,
- for bars, chevrons, pentagons and arrows: show a percentage fill (see below),
- for vertical lines: choose an End Marker (none, triangle, diamond or circle) and how far the line extends below the chart.
For a quick color change, simply right-click the element: a small format bar with fill and outline colors appears next to the menu.
Show progress with a percentage fill
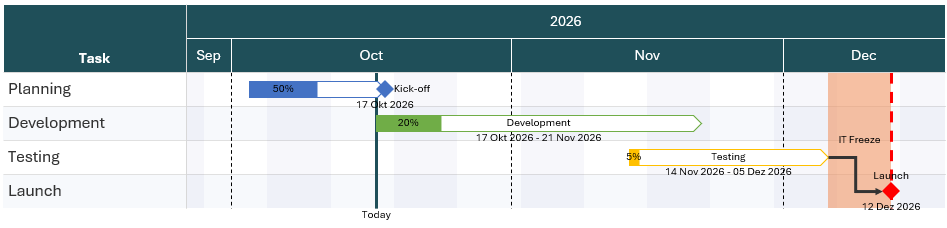
Bars, chevrons, pentagons and arrows can show how far along an activity is: the element is filled in its color up to the percentage you set, the rest stays white, and the percentage is written on the filled part.
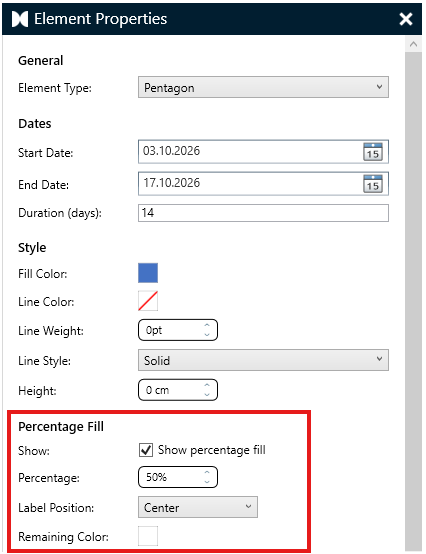
- Double-click the element to open its properties.
- Under Percentage Fill, tick Show percentage fill.
- Enter the Percentage (0 to 100).
- Choose the Label Position: Left, Center (the default) or Right on the filled part - or No Label to show the fill without the number.
- Click OK.
- The percentage is measured on the element's full duration - 50% always ends halfway between its start and end date, even if part of the element lies outside the chart.
- The fill follows the shape exactly, including the point of a chevron or pentagon.
- Remaining Color sets the color of the part not yet reached - white by default.
- An element without an outline gets a thin outline in its own color, so the unfilled part stays visible on a white slide.
- The percentage uses the element's label color, font and font size.
Highlight Phases with Blocks
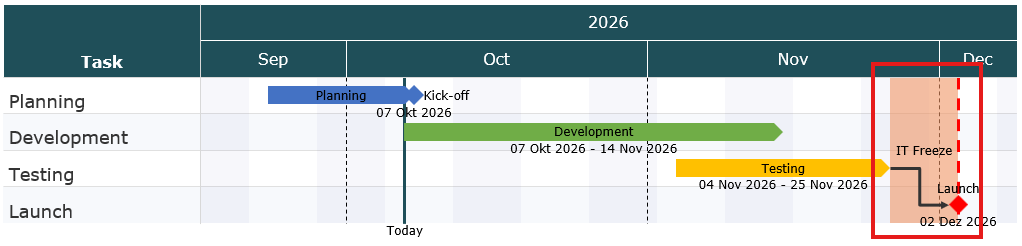
A block is a shaded area that spans several tasks and a period of time - perfect for marking a project phase, a holiday freeze or a testing window.
- Draw a block: Hold Shift, then click and drag across the chart. Alternatively, right-click a task row and choose Add Element > Block.
- Move or resize it: Drag the block, or drag one of its edges.
- Change color and label: Right-click the block, or double-click it to open its properties.
Show Dependencies with Connectors
Connectors are arrows that show that one activity depends on another - for example, "Testing" can only start once "Development" is finished.
- Right-click the first element and choose Add Connector.
- Move the mouse over the element - small hooks appear on its edges.
- Drag from a hook to a hook on the second element and release.
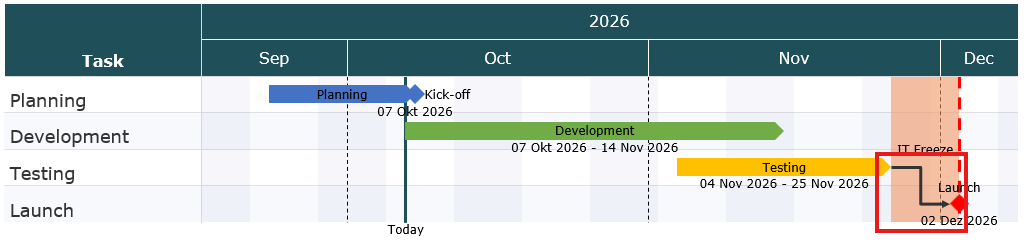
Connectors stay attached when you move the elements. To remove one, click it and press Delete. To change its color or line style, right-click it. Press Esc to leave connector mode without adding a connector.
Add Extra Columns
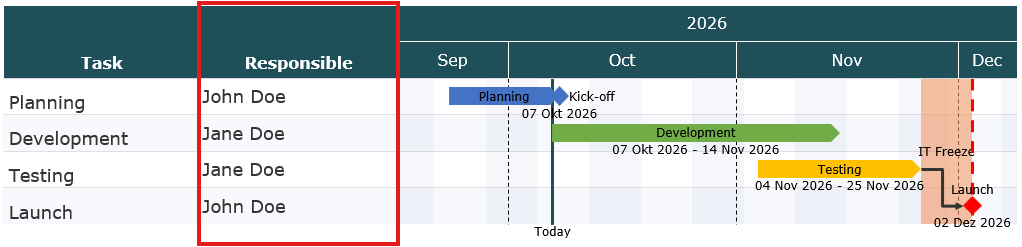
Besides the task names, you can show more information next to your timeline, such as an owner, a status or a budget.
- Right-click an empty area of the chart and choose Add Column Left or Add Column Right.
- Double-click a cell in the new column to type a value.
- Right-click the column header to rename the column, add another one or delete it. Double-click the header to change how the column looks.
Gantt Settings
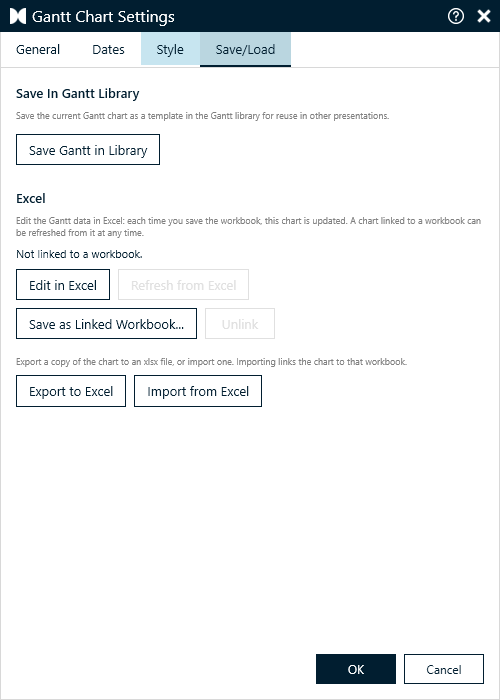
The Gantt Settings control how your chart looks and which period it shows. To open them, click the small settings button at the top-left corner of the chart, or right-click the chart and choose Gantt Settings.
| Tab | What you can change |
|---|---|
| General | Language of month and day names, the date format of your elements, and word wrap for task names. |
| Dates | The period shown on the chart, the timeline rows at the top, weekends - and Parallel Shift to move your whole plan. |
| Style | Row and element sizes, fonts, colored stripes and separator lines. |
| Save/Load | Save the chart as a template, edit it in Excel, link it to a workbook, or export it to and import it from Excel. |
Click OK to apply your changes, or Cancel to discard them.
Change the Date Range and Timeline
On the Dates tab you set the Start Date and End Date of the chart. Everything outside this range is not shown.
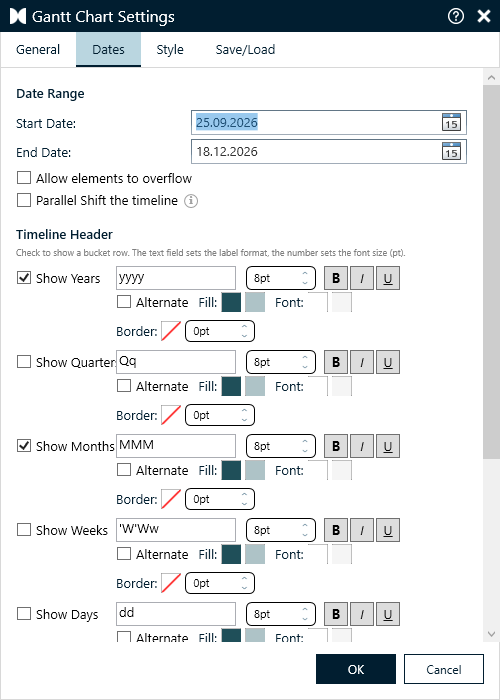
Tick Allow elements to overflow to keep elements that start before the Start Date or end after the End Date visible: they are drawn up to the edge of the chart with an arrow end. Unticked, they are simply cut off at the chart edge.
Timeline header
Under Timeline Header you choose which rows appear above the chart: Years, Quarters, Months, Weeks and Days. For each row you can set:
- the label format - for example "MMM" shows "Oct", "MMMM" shows "October",
- the font size and bold, italic or underline,
- the colors - tick Alternate to switch between two colors, which makes long timelines easier to read.
Month names
Want "Jan, Feb, Mrz" or your own abbreviations? Under Month Names, enter twelve names separated by ;. They are used wherever a format shows the month name (MMM or MMMM). Leave the field empty to use the names of the chart's language.
Weekends
Pick which days count as the weekend (for example Saturday / Sunday) and tick Highlight Weekends to shade them in the chart.
Move the Whole Plan with Parallel Shift
Projects get postponed. Instead of moving every bar and milestone by hand, let presentaid move the entire plan for you.
When Parallel Shift the timeline is ticked and you change the Start Date, presentaid moves the End Date and every element - bars, milestones, lines and blocks - by exactly the same number of days. Durations, labels and the spacing between your activities stay exactly as they are.
Example: Your plan starts on 30.10.2026 and the kick-off moves four weeks later. Change the Start Date to 27.11.2026 - the whole chart, including every bar and milestone, moves four weeks later as well.
- Open the Gantt Settings and go to the Dates tab.
- Tick Parallel Shift the timeline.
- Change the Start Date. The End Date updates immediately to match.
- Click OK.
Your choice is remembered for each chart, so the box is still ticked the next time you open the settings of the same chart.
Change the Look
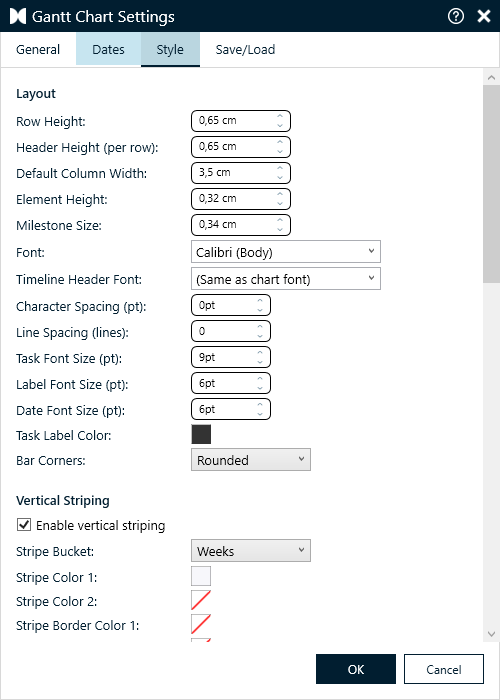
On the Style tab you fine-tune the appearance of your chart:
- Layout: row height, header height, column width, and the size of bars and milestones.
- Fonts: the font and the font sizes for task names, labels and dates. By default the chart uses the font of your presentation.
- Striping: alternating row colors, or vertical stripes per month, week or other time period, to make the chart easier to read.
- Separator lines: thin lines between the rows or between time periods.
- Major vertical separator: a second, coarser level of separator lines - for example solid quarter lines over dashed month lines. Where both meet, only the major line is drawn.
- Grid lines and frame: lines along the edge of the task column and under the timeline header, and optionally a frame around the task area and between the columns.
- Text details: character spacing and line spacing, the timeline header font and the color of the task labels.
Save and Share Gantt Charts
You can save Gantt Charts in your library for later use or for sharing with your colleagues. Open the Gantt Settings, go to the Save/Load tab and click Save Gantt in Library. The chart is saved as a template in the Gantt Library and can be reused in other presentations.
To use a chart on another slide, right-click an empty area of the chart and choose Copy Gantt, then paste it wherever you need it. The copy is an independent chart that you can edit separately.
Edit Your Chart in Excel
Large plans are often quicker to maintain in a spreadsheet. presentaid lets you edit a Gantt Chart's data in Excel - tasks, dates, colors, labels and every setting - and every time you save the workbook, the chart on your slide updates.
Edit in Excel
- Open the Gantt Settings and go to the Save/Load tab.
- Click Edit in Excel. The chart's data opens in Excel.
- Make your changes and save the workbook (Ctrl+S). A moment later the chart on the slide shows them.
- Save as often as you like. When you are done, close the workbook.

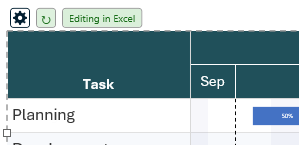
While the chart is being edited in Excel, an Editing in Excel note appears next to the settings button at the top of the chart.
- A chart that is not linked to a workbook is edited in a temporary copy. The copy is deleted when you close it; your changes stay in the chart.
- A chart that is linked to a workbook (see below) opens that workbook, so your changes are kept there as well.
- PowerPoint does not need to be in front: the chart updates while you keep working in Excel.
How the workbook is organized
The workbook has one sheet per part of the chart: Config (the chart settings), Tasks (one row per bar or milestone), Blocks, VerticalLines, Connectors and Columns.
- The header row stays in view on every sheet while you scroll.
- Fields with fixed choices - element types, label positions, line styles and every True/False setting - offer a dropdown.
- Colors are read from the fill color of the cell: color the cell to change the color in the chart. The Opacity% column next to it sets the transparency.
- A task with several elements uses several rows with the same task name.
- You can use formulas, for example to calculate end dates from start dates. Sheets of your own, and columns added after the last column, are ignored.
Link a chart to a workbook
A linked chart remembers its workbook, so you can keep the data in Excel and refresh the chart whenever the workbook changes.
| Option | What it does |
|---|---|
| Save as Linked Workbook... | Saves the chart to a new workbook and links the chart to it. |
| Import from Excel | Replaces the chart with the content of a workbook and links the chart to it. |
| Refresh from Excel | Updates the chart from its linked workbook. |
| Unlink | Keeps the chart as it is, but no longer refreshes it from the workbook. |
| Export to Excel | Saves a copy of the chart to a workbook, without linking it. |
A linked chart shows a refresh button next to the settings button. When the workbook was saved after the last refresh, the button shows an orange dot - click it to bring the chart up to date.
The Save/Load tab also shows which workbook the chart is linked to and whether it is up to date.
Keyboard Shortcuts
| Shortcut | What it does |
|---|---|
| Ctrl+Z | Undo the last change |
| Ctrl+C / Ctrl+V | Copy and paste the selected element or block |
| Delete | Delete the selected element, block or connector |
| Shift + drag | Draw a block |
| Enter / Esc | Confirm or cancel while editing a name or label |
| Esc | Leave connector mode |
Convert a Gantt Chart from Another Tool
Does your deck already contain a Gantt chart built with another PowerPoint add-in? presentaid can turn it into a presentaid Gantt chart that looks like the original - and that you can then edit like any other, without the other add-in.
- Select any shape of the Gantt chart - a bar, a label or the timeline.
- The action bar appears with a single button: Edit with presentaid.
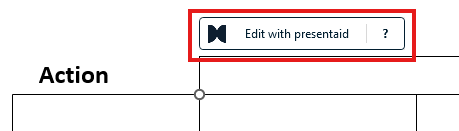
Edit with presentaid on a Gantt from another tool - Click it. presentaid explains what is about to happen and asks you to confirm.
- Confirm. A moment later the slide holds a presentaid Gantt chart in the same place - click it to open the editor.
What comes across
| The original | The presentaid Gantt chart |
|---|---|
| Timeline header (years, quarters, months, weeks, days) | The same timeline rows - the dates are read from the header |
| Task rows and their names | Tasks in the same order, with the same row heights and text positions |
| Bars and milestones | Elements with real start and end dates, read from where they sit on the timeline |
| Labels and dates next to bars and milestones | Element labels and dates in the same position, including their background fill |
| Vertical date lines | Vertical lines at their date, with the same end marker |
| Gridlines | Separator lines following the same calendar pattern |
From then on, the dates are real dates: move a bar and its dates follow, use Parallel Shift to move the whole plan, or export it to Excel.
What to check afterwards
When something could not be carried over exactly, presentaid tells you right after the conversion. Typical cases:
- The timeline names no year - for example only months. presentaid then assumes the current year; check the Start Date in the Gantt Settings.
- Two labels shared one task row - their texts were joined into one task name.
- Week lines that start on a day other than Monday - presentaid draws them from Monday.
- Gridlines that follow no calendar pattern - they are left out.
Converting a whole deck
presentaid ribbon → About → Expert Tools → Charts → Convert all Charts converts every chart and every Gantt chart made with other tools in one pass - Gantt charts first. If a Gantt chart needs a second look, the summary says so; convert that one on its own to see the details. See also Converting Charts Made with Other Tools.