

A status report in PowerPoint is usually a table: one row per project, workstream or requirement, with a status (often red, amber, green), progress, owner, next milestone and a short comment. The data almost always lives in Excel - or in a SharePoint list - and the report has to be rebuilt every week or month. There are three ways to get it from Excel into PowerPoint: copy and paste, a linked Excel object, or an add-in such as presentaid that turns the Excel rows into a formatted slide table you can refresh.
Start with the Data, Not the Slide
Whichever way you choose, the report is only as good as the sheet behind it. Before you build anything:
- One row per item, one column per field. A flat table with a single header row - no merged header blocks, no subtotals in between. An auto-filter or an Excel table (Ctrl+T) makes the structure explicit.
- Fixed status values. Decide on exactly one spelling - for example G, A, R - and use data validation so nobody types "green-ish".
- Short comments. A status cell that needs five lines on the slide needs rewriting, not a smaller font.
- One source of truth. One workbook (or SharePoint list) that all project leads update, instead of one file per project that someone merges by hand.
Option 1: Copy and Paste
- In Excel, select the range and press Ctrl+C.
- In PowerPoint, choose Home → Paste and pick a paste option: Use Destination Styles (a PowerPoint table in your deck's theme), Keep Source Formatting, Embed or Picture.
That is fine for a one-off slide. For a recurring report it means pasting again every cycle, re-applying the formatting and checking that no row went missing. Conditional formatting from Excel arrives only as fixed colors, so every status change means another paste.
Option 2: A Linked Excel Object
- In Excel, copy the range.
- In PowerPoint, choose Home → Paste → Paste Special, then select Paste link and Microsoft Excel Worksheet Object.
- When the workbook changes, PowerPoint offers to update the links as you open the presentation. You can also right-click the object and choose Update Link, or manage all links under File → Info → Edit Links to Files.
The numbers stay current, but the result is an image of the Excel range: fonts, colors and row heights come from Excel, not from your slide template; long tables shrink to unreadable sizes; and the link breaks when the workbook is renamed or moved. Colleagues without access to the file see the last state.
Option 3: The presentaid Dynamic Grid
The Dynamic Grid builds the status table from native PowerPoint shapes, styled like the rest of your deck, and stays connected to the Excel data.
- Create the template once (Template Mode). In Excel, select the sheet and click Create Template in the presentaid ribbon - or start in PowerPoint with Add Grid and Load Data from MS Excel. Add the columns you need by clicking their headers in the task pane and pick a column type for each: text, number, date, RAG status, Harvey ball, progress bar, trend arrow and more. Grouping joins rows with the same value, for example all requirements of one program. Save the layout with Save Grid Layout As. Step by step: create a Dynamic Grid
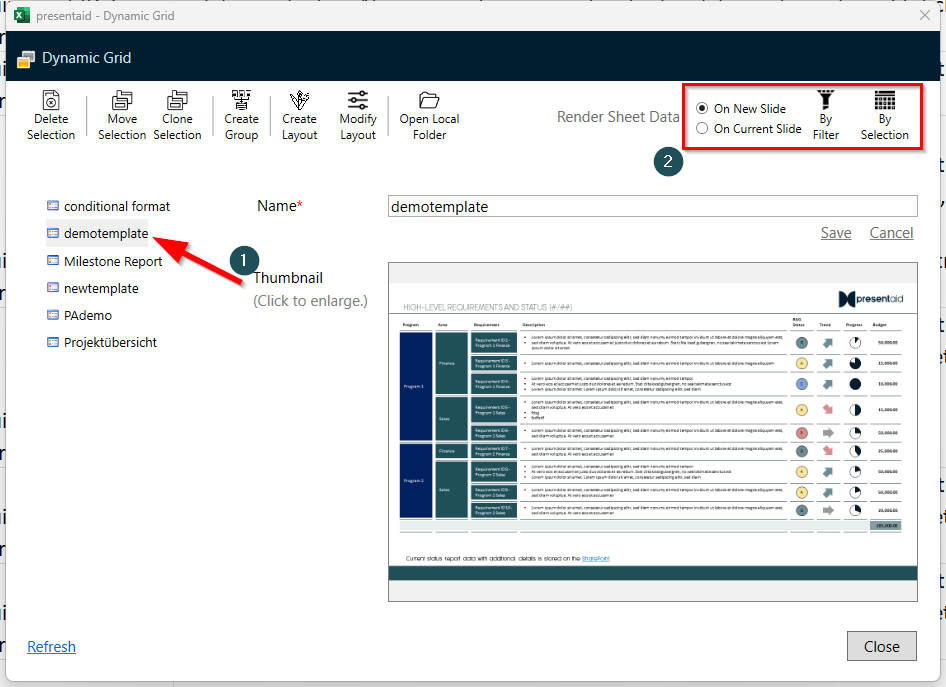
- Fill it with data (Render Mode). Filter the Excel sheet if you only need part of it, open the Template Manager, pick your template and choose whether to render the filtered or the selected rows, on a new or the current slide. Populate a template
- Refresh every cycle. Update the workbook, select the grid on the slide and click Refresh Data. The grid pulls in the latest values and keeps layout, styles and position. Right-click Refresh Data to change the filter, for example to show only red and amber items. Refresh and change the filter
Pivot tables work as a source too, and with presentaid Insider enabled you can connect a SharePoint list instead of an Excel file - handy when project leads update their status in a list. Use a SharePoint list as data source
Tips for Status Reports People Actually Read
- Lead with the exceptions. A headline like "2 of 9 projects at risk - budget overrun in Program 2" says more than "Project status overview". Sort or filter so red and amber items come first.
- Keep the template under version control. Store it in a shared library on SharePoint; the version history shows every change and lets you roll back. Shared Libraries
- Test with awkward data. Empty cells, a very long comment, a budget of zero or a negative variance - check how the slide looks before the steering committee does.
- Refresh on a fixed rhythm. Same day, same time each cycle, so everyone knows which data the report shows.
FAQ
Can I update a PowerPoint table automatically from Excel?
With built-in tools only as a linked Excel object, which updates the numbers but keeps Excel's formatting. With the presentaid Dynamic Grid you refresh a native, on-brand PowerPoint table with one click.
Can colleagues without presentaid edit the status report?
Yes. The Dynamic Grid consists of native PowerPoint shapes, so anyone can open and edit the slide in a standard PowerPoint installation. Refreshing the data from Excel requires presentaid.
What about Power BI?
Microsoft offers a Power BI add-in for PowerPoint that shows live Power BI report pages on a slide. It suits interactive dashboards; viewers need access to the report, and the layout comes from Power BI rather than from your slide template.
Does the Excel file need a special structure?
A flat table with one header row. Set an auto-filter or define the range as an Excel table so the Dynamic Grid can tell headers from data.
More: Automated status reports · Introduction to the Dynamic Grid
Want to try it with your own status data? presentaid is free for 30 days, no credit card required.
Start your free trial