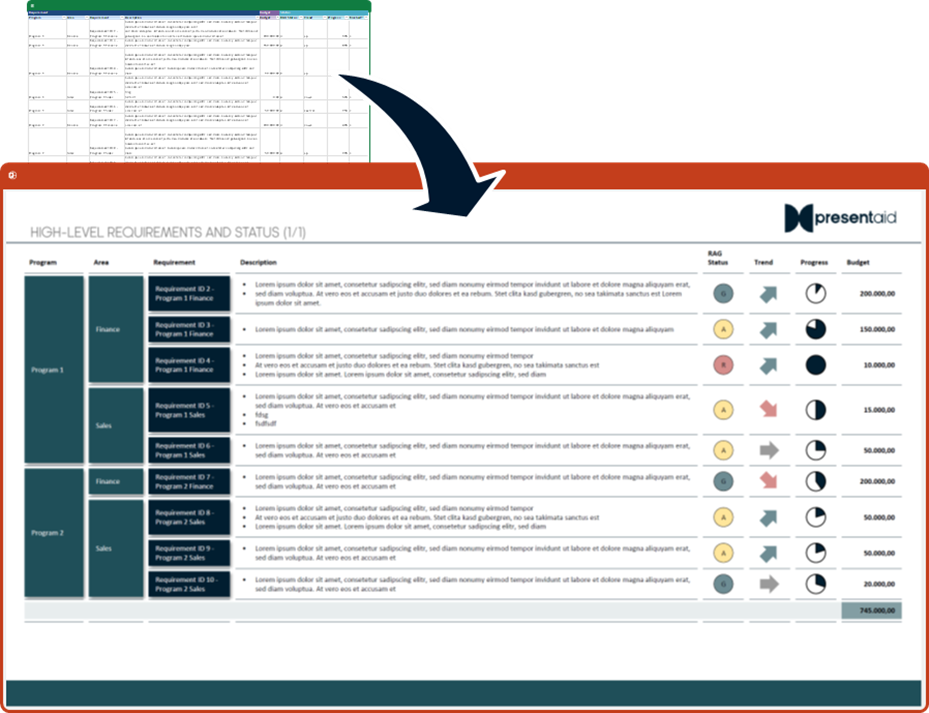
With the presentaid Dynamic Grid you can easily visualize your Excel data in PowerPoint with all the functionalities and formatting styles that you already know.

We differentiate between the “Template Mode” and the “Render Mode”.
The Template Mode is what you usually start with. It is used to define the layout of your Dynamic Grid. This includes colors and other formatting styles, but also the column width, display format (e.g. Shape, RAG status, Harvey Ball, …), column parameters (e.g. total line, number format, …).
Once you have defined your template, you can easily populate this template in the Render Mode. At this stage you can define the data that you would like to fill in your template by either selecting the respective line items or simply using the Excel Autofilter.