If you want to create a Dynamic Grid you can start either from your PowerPoint presentation or your Excel data. For the Dynamic Grid to work properly it is important to have flat data table so that the column headers and data can be identified. The easiest way to achieve this is to set an auto-filter or to define a table range on your Excel sheet.
Create a new Dynamic Grid #
Starting from PowerPoint #
- Select the slide that you want to place the Dynamic Grid on
- Click Add Grid in the Ribbon

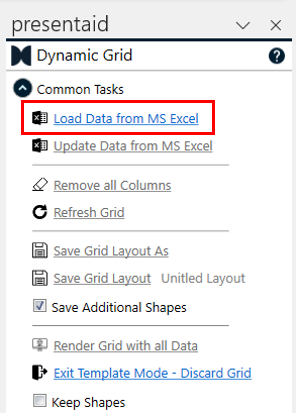
- In the newly opened task pane on the right select Load Data from MS Excel
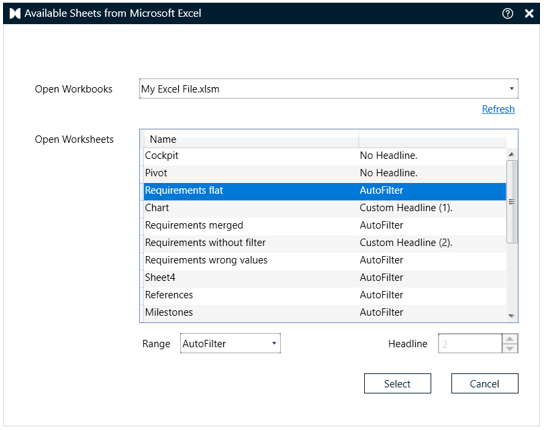
- Select the data that you want to load.
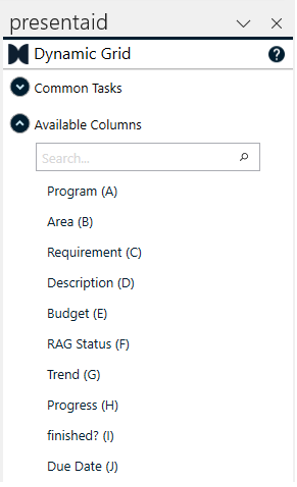
- The Excel data is now available in PowerPoint
Starting from Excel #
- Select the sheet that contains the data that you want to present
- Click Create Template. The Excel data will now be pushed to your PowerPoint presentation

- The Excel data is now available in PowerPoint
Configuring your Dynamic Grid #
- To add columns simply click on the column header in the taskpane
- To change the style of a column you can use the standard PowerPoint tools to change e.g. font, fill, outline, …

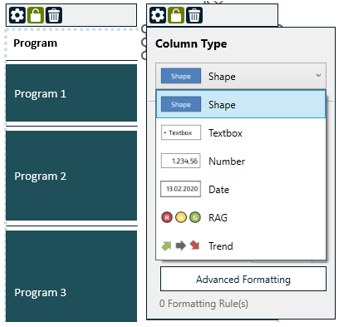
- The column type can be switched by selecting a header shape of the column that you’d like to change and selecting your preferred column type.
- Once you are done with the layouting you can save the Grid Layout template by clicking Save Grid Layout As. You can save the Dynamic Grid with or without “Additional Shapes”. Additional Shapes are shapes shown on the slide which are not part of the Dynamic Grid itself, e.g. a footnote, a header etc.
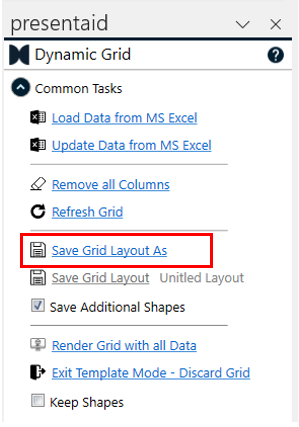
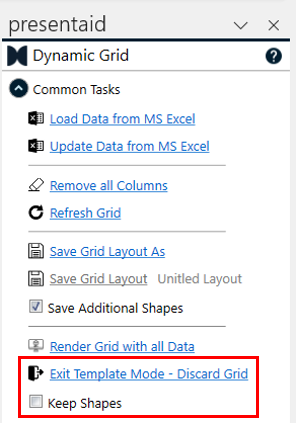
- To exit the Dynamic Grid click on Exit Template Mode - Discard Grid. You can chose whether you want to keep the current Grid shapes on the slide.
