
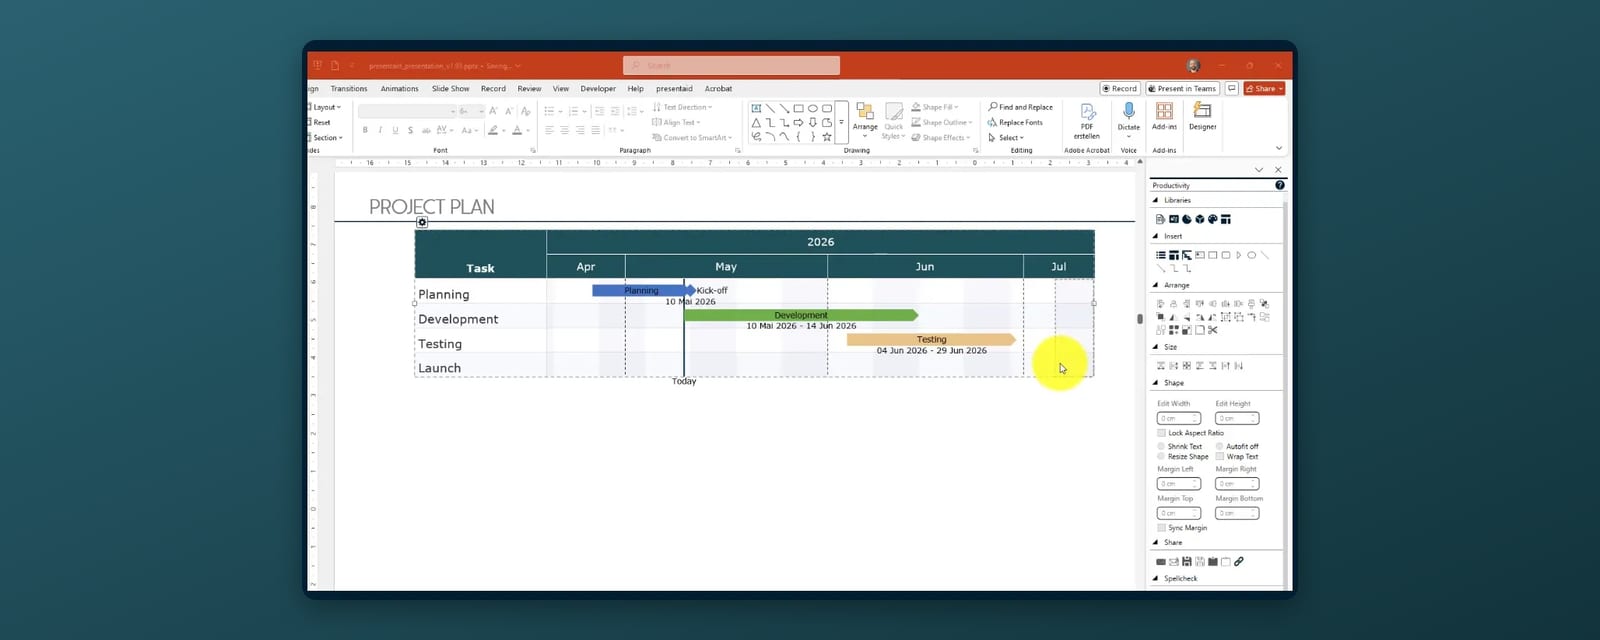
A Gantt chart shows tasks as bars on a timeline, so everyone can see what happens when, what overlaps and where the milestones are. PowerPoint has no built-in Gantt chart type. You can draw one with shapes, fake one with a stacked bar chart, or use a Gantt add-in that edits the timeline directly on the slide. The right choice depends on one question: how often will the schedule change?
What Belongs on a Project Gantt Slide
- Tasks or workstreams as rows, grouped into phases if there are more than about eight.
- Bars from start to end date for each task.
- Milestones (kick-off, steering committee, go-live) as markers, not bars.
- A time scale that fits the audience: weeks for a team update, months or quarters for a steering committee.
- A "today" line, so the status is visible at a glance.
Leave out what the audience does not need - resource names, percent complete for every task, dependencies arrows on a summary slide. A Gantt slide is a communication tool, not your project plan.
Option 1: Draw It with Shapes
Insert a table or a set of rectangles for the time grid, then draw one rectangle per task and a diamond per milestone.
This is quick for a one-off slide and gives full design control. It breaks down the moment dates move: every bar has to be resized and repositioned by hand, and keeping bars aligned to the grid is tedious. Fine for a pitch, painful for a weekly status report.
Option 2: The Stacked Bar Chart Workaround
- Create a small table with three columns: task, start date, duration in days.
- Go to Insert → Chart → Bar → Stacked Bar and paste the start dates as the first series and the durations as the second.
- Format the first series with no fill - the remaining bars now float at the right dates.
- Reverse the category order on the vertical axis so the first task is at the top, and set the horizontal axis minimum and maximum to the project's first and last date.
The bars now follow the data, which is an improvement over shapes. But milestones, a today line and phase groupings still have to be added as separate shapes, and the axis settings have to be adjusted whenever the project extends.
Option 3: The presentaid Gantt Editor
presentaid adds a WYSIWYG Gantt editor that works directly on the slide - no data sheet, no formulas.
- Click the Gantt Chart button in the presentaid ribbon or in the Productivity Pane. If you have saved Gantt templates, your Gantt library opens and you can start from one of them.
- A Gantt chart is added to your slide. Add tasks, set start and end dates, define milestones and group tasks into phases.
- Edit by drag and drop: move a bar to shift a task, drag its edge to change the duration. Context menus give you the remaining options.
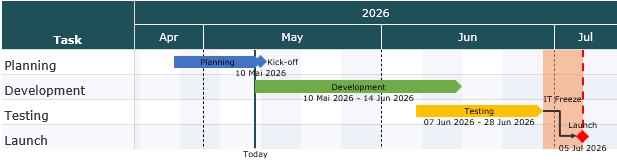
The result is made of native PowerPoint objects, so anyone can open and edit the slide without the add-in.
To reuse a timeline, open the Gantt settings and go to Save/Load:
- Save Gantt in Library keeps it as a template for future decks and for colleagues.
- Export to Excel writes the tasks and settings to a readable .xlsx file - handy when a project manager maintains the dates.
- Import from Excel updates the chart from the edited file.
Which Option Should You Use?
- One-off slide, design matters most: shapes.
- Occasional updates, no add-in available: stacked bar chart.
- Regular status reporting or many timelines: a Gantt editor. The time saved on the second update already pays for the setup.
Tips for Gantt Slides People Actually Read
- One message per slide. "Go-live moves two weeks; critical path unaffected" in the headline, the Gantt as the proof.
- Highlight what changed since the last report - a different color for delayed tasks works better than a legend with eight colors.
- Show the today line. Without it, the audience has to calculate where the project stands.
FAQ
Does PowerPoint have a Gantt chart template?
PowerPoint has no Gantt chart type. Microsoft offers downloadable timeline templates, but they are built from shapes and need manual updates when dates change.
Can I make a Gantt chart in PowerPoint without Excel?
Yes. You can draw it with shapes, or use a Gantt editor such as presentaid's, which needs no Excel data or formulas.
Can colleagues without presentaid edit the Gantt chart?
They can open and edit the slide in any standard PowerPoint installation, because presentaid creates native PowerPoint objects. Comfortable drag-and-drop editing of the timeline requires presentaid.
More: PowerPoint Gantt chart feature · Guide: working with Gantt charts · PMO & project management