presentaid Charts geben dir die Diagrammtypen und Anmerkungswerkzeuge, die Berater und Analysten heute von Hand erstellen - Wasserfälle, Mekkos, Waffeldiagramme, Schmetterlinge, Wachstumspfeile, CAGR-Linien, Wertlinien und Achsenunterbrechungen - ohne PowerPoint zu verlassen und ohne auf die native Chart-Engine zu verzichten.
Deine Charts bleiben native PowerPoint-Charts
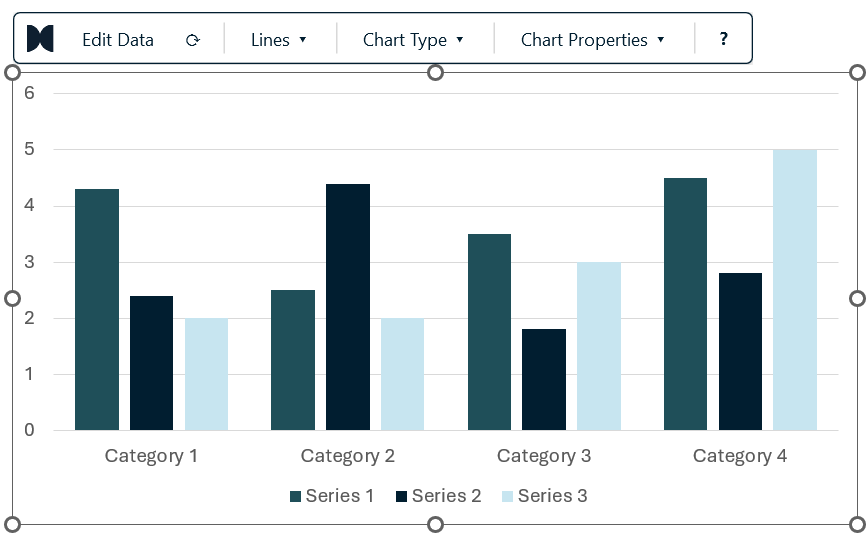
Das ist der wichtigste Punkt, den du zu dieser Funktion wissen solltest: presentaid ersetzt das PowerPoint-Chart niemals durch ein Bild oder eine Gruppe von Formen. Alles, was du einfügst, ist ein echtes PowerPoint-Chart mit einem echten eingebetteten Datenblatt.
Das hat Konsequenzen, die du jeden Tag spürst:
- Kollegen ohne presentaid können dein Deck weiterhin öffnen, auf das Chart klicken und die Daten bearbeiten. Nichts ist gesperrt.
- Das Chart folgt weiterhin deinem Corporate Template, den Themenfarben und Schriftarten.
- Kopieren, Einfügen, Folien duplizieren und Slide-Library-Roundtrips funktionieren alle genau wie zuvor.
- Alles, was presentaid zusätzlich hinzufügt - Pfeile, Beschriftungen, Verbindungslinien, Break-Markierungen - wird als normale Form innerhalb des Charts gezeichnet und wandert daher mit ihm mit.
Die zwei Hälften der Funktion
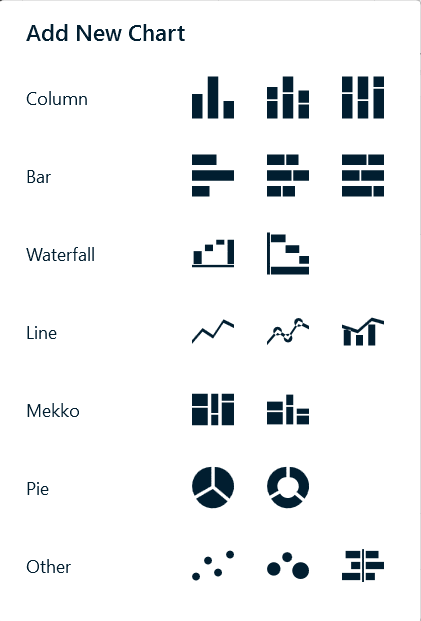
Diagrammtypen. Eine visuelle Auswahl mit den Familien, die du tatsächlich präsentierst: geclusterte, gestapelte und 100%-gestapelte Säulen und Balken, Linien- und Säulen-Linien-Kombinationen, Wasserfall (Säule und Balken), Mekko in zwei Varianten, Kreis und Ring, Waffel-, Streu-, Blasen- und Schmetterlingsdiagramme.
Chart-Dekoration. Eine schwebende Aktionsleiste, die erscheint, sobald du ein Chart auswählst, mit Wachstumspfeilen, CAGR-Pfeilen, Differenzpfeilen, Wertlinien, Achsenunterbrechungen, Summenbeschriftungen, Segmentsortierung, Skalenausrichtung über mehrere Charts hinweg und einer Live-Verknüpfung zu einer Excel-Datei.
Wo du es findest
Alles beginnt in der Gruppe Charts im presentaid-Ribbon oder über Insert Chart im Productivity Pane.