
Die Chart-Auswahl öffnen
- Gehe zum presentaid-Ribbon und klicke in der Gruppe Charts auf Insert Chart.
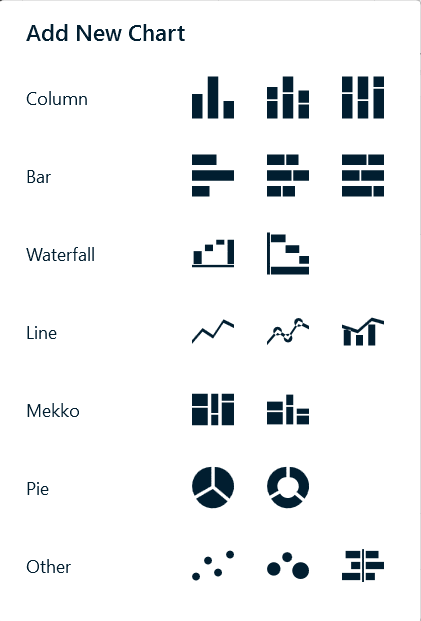
- Die Chart-Auswahl öffnet sich an deinem Mauszeiger - mit einer Zeile pro Diagrammfamilie und einer kleinen Vorschau jeder Variante.
- Fahre über eine Kachel, um ihren Namen zu sehen; klicke sie an, um diesen Diagrammtyp auszuwählen.
Drei Wege, das Chart zu platzieren
Sobald du einen Typ ausgewählt hast, bietet dir presentaid denselben Platzierungsablauf, den du vom Zeichnen einer Form kennst:
- Einmal auf die Folie klicken - das Chart wird in einer sinnvollen Standardgröße eingefügt und horizontal und vertikal zentriert auf der Folie.
- Ein Rechteck auf der Folie aufziehen - das Chart wird genau in dem Bereich erstellt, den du gezogen hast.
- Erst eine Form auswählen, dann einfügen - das Chart ersetzt diese Form und übernimmt ihre exakte Position und Größe. Das ist der schnellste Weg, um einen Platzhalter in einem Template zu befüllen.
Das eingebettete Datenblatt öffnet sich automatisch, sodass du deine Zahlen sofort eingeben kannst.
Die Daten später bearbeiten
Wähle das Chart aus und klicke in der Aktionsleiste auf Edit Data. Dies öffnet genau dasselbe eingebettete Datenraster, das PowerPoint selbst verwendet, gescrollt zu Zelle A1.
Bei den konstruierten Diagrammtypen (Wasserfall, Mekko, Schmetterling) enthält das Blatt einen kleinen Block versteckter Hilfsspalten mit live-Excel-Formeln. Du musst sie nie anfassen - sie sind geschützt und berechnen sich automatisch neu, während du die sichtbaren Eingabespalten bearbeitest.
Ein Waffeldiagramm braucht gar keine Hilfsspalten: Sein Blatt besteht nur aus einer Spalte mit Namen und einer Spalte mit Werten.