
Ein verknüpftes Chart liest seine Daten aus einem Bereich einer externen Excel-Arbeitsmappe, statt dass du sie eintippst. Das Chart selbst bleibt ein normales natives PowerPoint-Chart - die Verknüpfung entscheidet nur, woher die Zahlen kommen.
Eine Verknüpfung erstellen
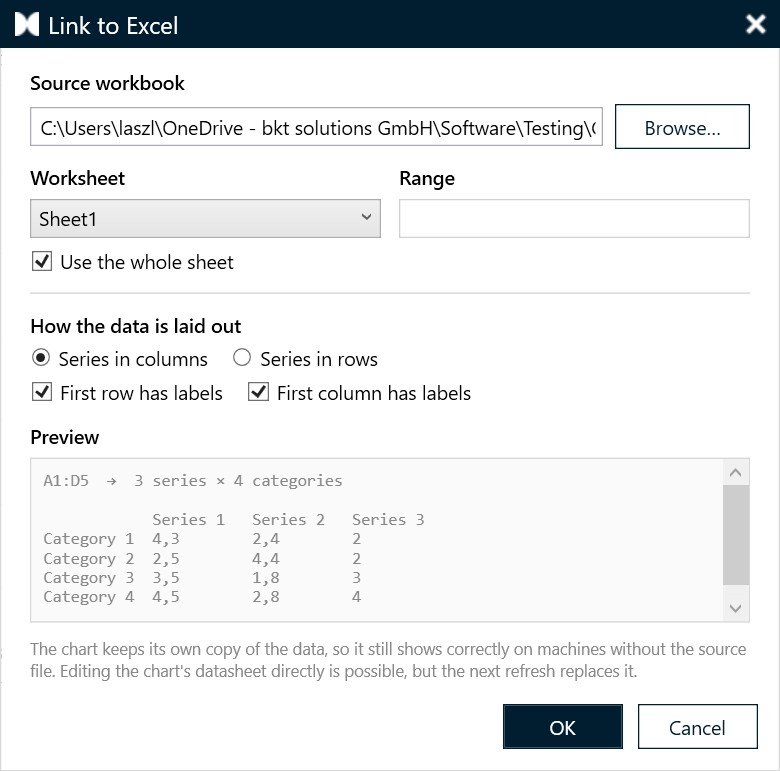
- Wähle das Chart aus und öffne Chart Properties → Excel data → Link to Excel.
- Wähle die Arbeitsmappe aus. Wenn die Datei bereits in Excel geöffnet ist, wähle sie aus dem Dropdown Open in Excel statt über den Dateibrowser - du musst sie nicht vorher schließen.
- Wähle das Blatt und den Bereich aus, oder aktiviere whole sheet.
- Lege fest, wie der Bereich auf das Chart abgebildet wird:
- Serien in Spalten oder Serien in Zeilen
- ob die erste Zeile Beschriftungen enthält
- ob die erste Spalte Beschriftungen enthält
- Die Vorschau zeigt genau, was ins Chart übernommen wird. Bestätige, und presentaid schreibt die Daten in das eigene Datenblatt des Charts.
Dateien verschieben, ohne die Verknüpfung zu brechen
presentaid speichert sowohl einen relativen als auch einen absoluten Pfad und löst zuerst den relativen auf.
- Verschiebst du Deck und Arbeitsmappe zusammen in einen anderen Ordner: die Verknüpfung funktioniert weiter.
- Verschiebst du nur das Deck: die Verknüpfung greift auf den absoluten Pfad der Arbeitsmappe zurück.
- Lässt sich keiner der beiden Pfade auflösen, sucht presentaid nach einer gleichnamigen Datei neben der Präsentation.
Aktualisieren - nach deinen Regeln
presentaid aktualisiert ein verknüpftes Chart niemals heimlich. Das Öffnen eines Decks ändert keine einzige Zahl unbemerkt.
Stattdessen beobachtet presentaid das Änderungsdatum der Quelldatei. Wenn sich die Datei seit deiner letzten Aktualisierung geändert hat, erscheint als erstes Element in der Aktionsleiste des Charts ein gelber Chip:
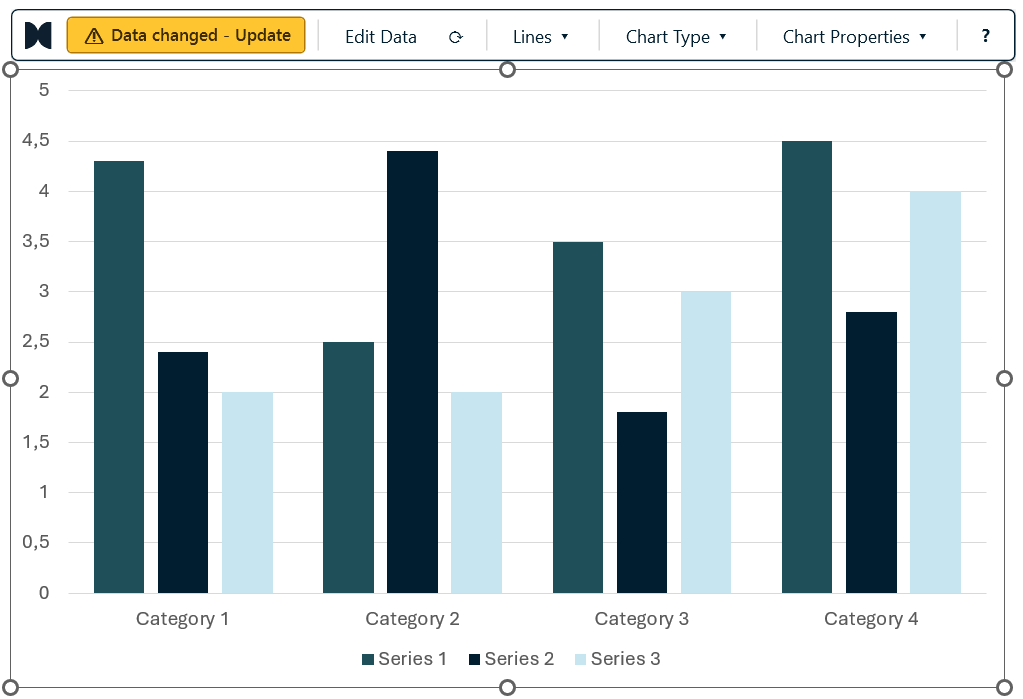
Klicke ihn an, um die neuen Daten zu übernehmen, oder ignoriere ihn und präsentiere, was du hast. Die Prüfung ist eine leichtgewichtige Abfrage des Dateidatums, die auch Änderungen während der Arbeit erkennt - bearbeite die Arbeitsmappe in Excel, wechsle zurück zu PowerPoint, und der Hinweis erscheint innerhalb weniger Sekunden, ohne dass du das Chart erneut auswählen musst.
Du kannst auch jederzeit über Chart Properties → Excel data → Refresh now aktualisieren oder die Verknüpfung mit Remove link ganz entfernen - das Chart behält die Daten, die es bereits hat.
Was mit deinen Anmerkungen passiert
Alles übersteht eine Aktualisierung. Wachstumspfeile verankern sich neu an ihren Kategorien, Wertlinien bleiben bei ihren Werten, individuelles Styling wird erneut angewendet, und Beschriftungstext wird aus den neuen Zahlen neu berechnet.