
Wähle ein beliebiges verwaltetes Chart aus, und eine kleine schwebende Leiste erscheint darüber. Sie folgt dem Chart, wenn du es verschiebst oder scrollst, und verschwindet, sobald du etwas anderes auswählst.
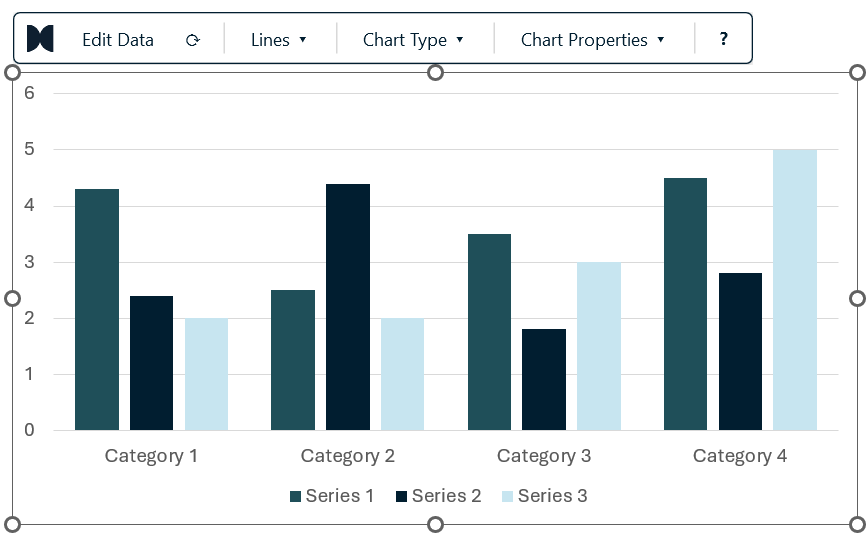
Edit Data
Öffnet das eingebettete Datenblatt des Charts, gescrollt zu A1. Gib deine Werte ein, und das Chart - inklusive jeder presentaid-Anmerkung darauf - aktualisiert sich live, während du bearbeitest.
Refresh
Der kreisförmige Pfeil liest das Chart neu ein und zeichnet alle presentaid-Dekorationen an ihren korrekten Positionen neu. Du brauchst ihn selten: presentaid rendert automatisch neu, sobald sich die zugrunde liegenden Daten oder die Chart-Geometrie ändern. Nutze ihn, nachdem du das Chart von Hand verändert hast, oder wenn du das Chart über die eigenen Dialoge von PowerPoint bearbeitet hast.
Lines
Das Menü Lines enthält alles, was über dem Diagramm gezeichnet wird:
- Growth arrow: ein Winkelpfeil zwischen zwei Datenpunkten, der die Differenz zeigt
- CAGR arrow: ein gerader Pfeil, der das durchschnittliche jährliche Wachstum zwischen zwei Punkten zeigt
- Difference arrow: ein vertikaler Doppelpfeil zwischen zwei Werten
- Value line: eine horizontale Referenzlinie bei einem festen Wert
- Show Connector Lines: die Stufenverbindungen zwischen Wasserfall-Segmenten
- Show Total Labels / Sort Segments: für gestapelte Charts
- Show Horizontal / Vertical Gridlines
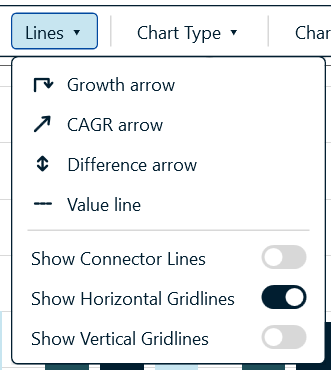
Chart Type
Wechselt zwischen Clustered, Stacked und 100% stacked, ohne das Chart neu aufzubauen.
Chart Properties
Ein Ausklappmenü mit den Einstellungen, die du normalerweise in mehreren verschiedenen PowerPoint-Dialogen suchst - Schriftgröße, Balkenbreite, Legendenposition, Datenbeschriftungen, Zahlenformat und Skala der Achse, Diagrammtitel, Achsenunterbrechungen, Skalenausrichtung und die Excel-Verknüpfung.
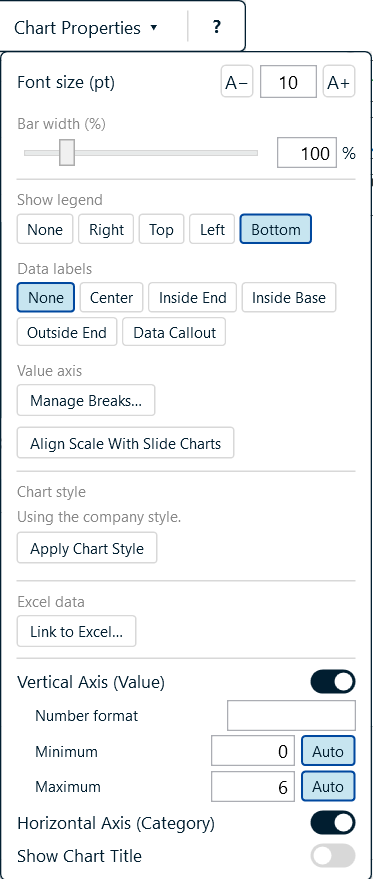
Das Ausklappmenü lässt sich verschieben, sodass du es zur Seite parken kannst, während du Charts vergleichst. Bei einem Waffeldiagramm zeigt es statt Balkenbreite, Datenbeschriftungen und Achsen die eigenen Einstellungen des Waffeldiagramms - Raster, Zellgröße, Symbol, Legendentext und Farben; siehe Waffeldiagramme.
Der Ribbon-Tab presentaid Charts
Ist ein Chart ausgewählt, zeigt PowerPoint seine eigenen Tabs Diagrammentwurf und Format. presentaid fügt daneben einen dritten Tab hinzu: presentaid Charts. Dort findest du die wichtigsten Chart-Aktionen an der gewohnten Stelle - im Ribbon.
| Schaltfläche | Was sie macht |
|---|---|
| Edit Data | Öffnet das Datenblatt des Charts - wie Edit Data in der Aktionsleiste |
| Refresh Decorations | Berechnet Beschriftungen und Positionen von Pfeilen, Linien und anderen presentaid-Dekorationen aus den aktuellen Daten des Charts neu - wie der kreisförmige Pfeil in der Aktionsleiste |
| Apply Style | Ein Klick auf die Schaltfläche wendet deinen Standard-Chart-Stil an; über ihre Liste wählst du einen anderen Stil. Siehe Chart Style Configurator |