Introduction
With the presentaid Gantt Chart you can easily create and edit project timelines directly in PowerPoint.
Add a Gantt Chart
Add a new Gantt Chart by clicking the button in the Ribbon or the button in the Productivity Pane.

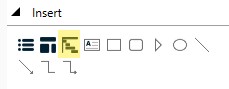
Note: If you have saved Gantt Templates already, clicking the button in the Ribbon/Productivity Pane will show your Gantt Chart Library, allowing you to pick an existing template.
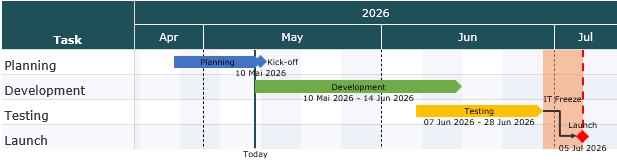
A new Gantt Chart is added to your slide, which you can easily edit via Drag and Drop and context menus.
Save and Share Gantt Charts
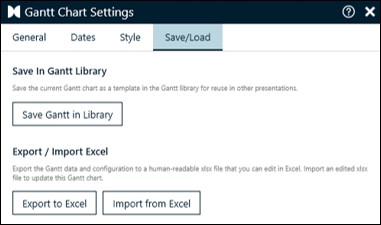
You can save Gantt Charts in your library for later use or for sharing with your colleagues. Open the Gantt Chart settings and navigate to the Save/Load tab.
| Option | Description |
|---|---|
| Save Gantt in Library | Saves the current Gantt Chart as a template in the Gantt Library for reuse in other presentations. |
| Export to Excel | Exports the Gantt data and configuration to a human-readable xlsx file that you can edit in Excel. |
| Import from Excel | Imports an edited xlsx file to update the current Gantt Chart. |